2019-09-04 17:55:00
U.S. LNG UP TO 10%
REUTERS - U.S. exports of liquefied natural gas (LNG), negligible just three years ago, now amount to 10% of the global market and at 22 million tonnes so far this year are equal to the total volumes pumped out in 2018, Refinitiv data showed on Tuesday.
The data, comprised of tracked individual journeys made by LNG tankers from supply source to destination, also showed LNG production hit an all-time high last month of 31 million tonnes.
As global volumes grow, Qatar, for years the world's largest LNG supplier, lost market share to Australia, which exported more LNG than any other country in the past two months.
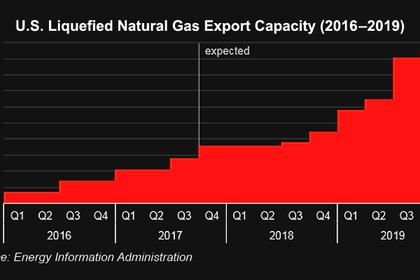
The supply surge has been long in the making as liquefaction and export facilities on the U.S. Gulf Coast come onstream after years of development, boosted also by a new mega-terminal in Russia's Arctic and facilities in Australia.
The batting order for the world's largest exporters has been Australia, Qatar, the United States, Russia and Malaysia for the past two months, whereas in previous years Nigeria and Indonesia vied for places in the top five.

Soaring supplies from U.S. LNG terminals have upended the global market not just by boosting volumes - and depressing prices - but also through flexible destination contracts with long-term buyers. Such deals allow countries' cargoes to ebb and flow as prices and demand dictate.
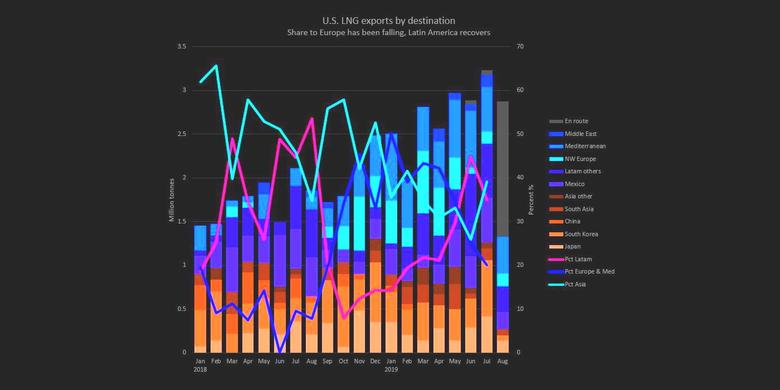
This is reflected in the data, which shows the influx of U.S. LNG to northwest Europe receded from a March peak while flows to Latin America picked up in periods of low hydropower.
Japanese and South Korean buyers, many of which supported U.S. projects at inception by committing to buy volumes, remained a strong albeit falling component of total sales.
But purchases by China stuttered to a halt in February as tariffs imposed on U.S. LNG by Beijing weighed on already poor pricing conditions for Asian buyers.
The U.S. supply surge has depressed global LNG prices, and with it, European benchmark gas prices, closing the arbitrage for cargoes between the Atlantic and Pacific basins. In addition, demand growth in Asia this year has been weak in the absence of extreme weather and in comparison to a strong 2018.

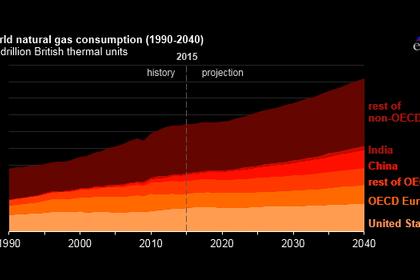
The LNG industry is set to continue its rapid development, taking advantage of the soaring energy needs of a richer developing world as well as demand for gas boosted by the fuel's relatively clean environmental credentials.
In the United States, export plants with a capacity of 46 million tonnes per year (mtpa) are in operation or ramping up, with another 27 mtpa approved, financed and being built.
At such numbers, U.S. production will rival Qatar's, although Doha plans to expand its own facilities to 110 mtpa.
New mega-projects with capacities of 10 mtpa or more and the expansion of existing facilities are planned in Mozambique, Nigeria, Arctic Russia, Canada's West Coast, Mexico and Papua New Guinea.

-----
Earlier:
2019, September, 3, 12:55:00
U.S. GAS FOR INDIA
India's Petronet LNG is eyeing stakes in gas projects in the US and other countries in an effort to strengthen its grip on the supply sources as it expects India's import demand to grow sharply
2019, August, 28, 12:35:00
U.S. LNG FOR LATIN AMERICA UP
Feedgas flows to US LNG export terminals reached a new record of 6.5 Bcf/d on Friday, subject to revisions, amid robust demand in Latin America and positive netback spreads that are expected to strengthen into October,
2019, August, 23, 10:25:00
U.S. WANT VIETNAM OIL AND GAS
U.S. energy firms had interests in the South China Sea and Washington was “committed to bolstering the energy security of our partners and allies in the Indo-Pacific region and in ensuring uninterrupted regional oil and gas production for the global market.”U.S. warships have conducted periodic “freedom of navigation” operations in the South China Sea to challenge China’s claim to nearly all of the strategic waterway.
2019, August, 21, 12:30:00
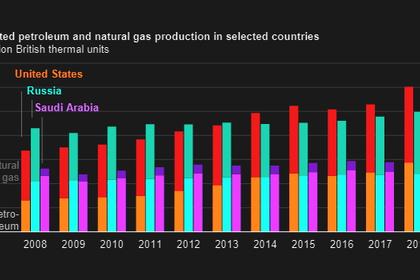
U.S. OIL, GAS PRODUCTION UP
U.S. petroleum and natural gas production increased by 16% and by 12%, respectively, in 2018, and these totals combined established a new production record.
2019, August, 21, 12:25:00
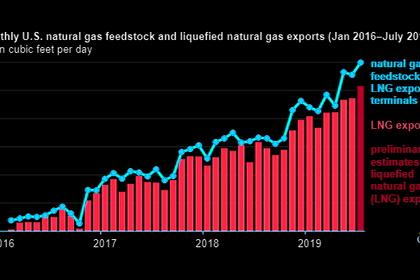
U.S. LNG EXPORTS UP
U.S. LNG exports set new records in June and July 2019 at 4.8 Bcf/d and 5.2 Bcf/d, respectively,
2019, August, 16, 10:25:00
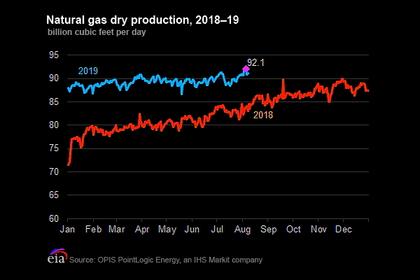
U.S. GAS PRODUCTION UP
U.S. natural gas production continued to increase in August despite relatively low natural gas spot prices
2019, August, 12, 13:15:00
U.S. GAS SALES UP
Russian gas sales on Gazprom Export's Electronic Sales Platform (ESP) rebounded above 100 million cu m in Thursday's auction, continuing a trend of steady strong sales on the platform this month.


