2019-09-23 13:40:00
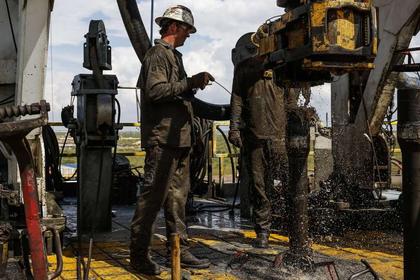
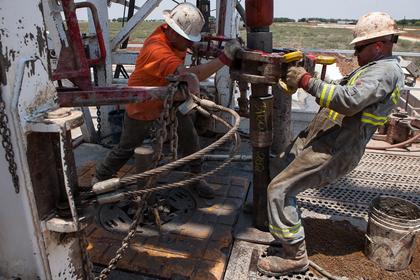
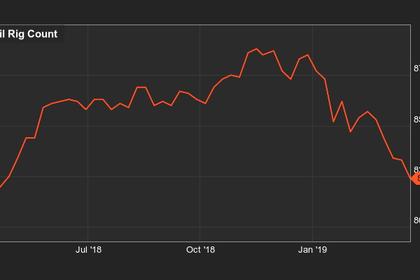
U.S. RIGS DOWN 18 TO 868
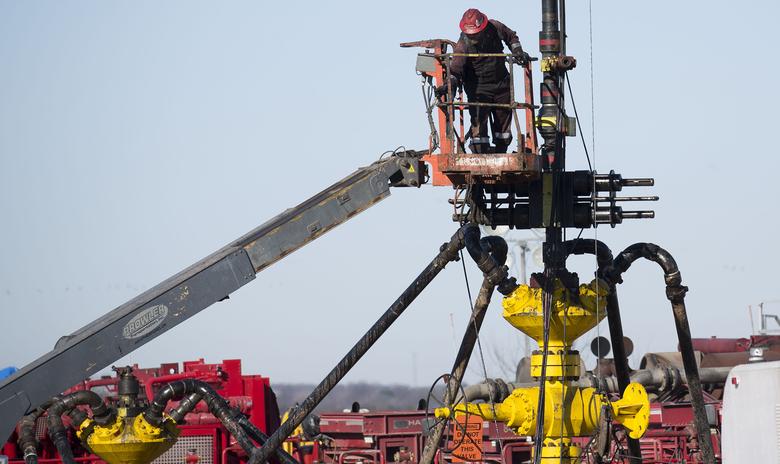
BHGE - U.S. Rig Count is down 18 rigs from last week to 868, with oil rigs down 14 to 719, gas rigs down 5 to 148, and miscellaneous rigs up 1 to 1.
U.S. Rig Count is down 185 rigs from last year's count of 1,053, with oil rigs down 147, gas rigs down 38, and miscellaneous rigs unchanged at 1.
The U.S. Offshore Rig Count is down 1 rig to 25 and up 5 rigs year-over-year.
Canada Rig Count is down 15 rigs from last week to 119, with oil rigs down 11 to 82 and gas rigs down 4 to 37.
Canada Rig Count is down 78 rigs from last year's count of 197, with oil rigs down 53 and gas rigs down 25.
| Rotary Rig Count | |||||||||
| 9/20/19 | |||||||||
| Week | Year | ||||||||
| Location | Week | +/- | Ago | +/- | Ago | ||||
| Land | 842 | -18 | 860 | -186 | 1028 | ||||
| Inland Waters | 1 | 1 | 0 | -4 | 5 | ||||
| Offshore | 25 | -1 | 26 | 5 | 20 | ||||
| United States Total | 868 | -18 | 886 | -185 | 1053 | ||||
| Gulf Of Mexico | 23 | -2 | 25 | 5 | 18 | ||||
| Canada | 119 | -15 | 134 | -78 | 197 | ||||
| North America | 987 | -33 | 1020 | -263 | 1250 | ||||
| U.S. Breakout Information | This Week | +/- | Last Week | +/- | Year Ago | ||||
| Oil | 719 | -14 | 733 | -147 | 866 | ||||
| Gas | 148 | -5 | 153 | -38 | 186 | ||||
| Miscellaneous | 1 | 1 | 0 | 0 | 1 | ||||
| Directional | 61 | 4 | 57 | -8 | 69 | ||||
| Horizontal | 756 | -20 | 776 | -163 | 919 | ||||
| Vertical | 51 | -2 | 53 | -14 | 65 | ||||
| Canada Breakout Information | This Week | +/- | Last Week | +/- | Year Ago | ||||
| Oil | 82 | -11 | 93 | -53 | 135 | ||||
| Gas | 37 | -4 | 41 | -25 | 62 | ||||
| Major State Variances | This Week | +/- | Last Week | +/- | Year Ago | ||||
| Alaska | 8 | 1 | 7 | 3 | 5 | ||||
| California | 15 | -2 | 17 | 0 | 15 | ||||
| Colorado | 26 | 0 | 26 | -6 | 32 | ||||
| Louisiana | 57 | -1 | 58 | -4 | 61 | ||||
| New Mexico | 109 | 1 | 108 | 10 | 99 | ||||
| North Dakota | 53 | -2 | 55 | 0 | 53 | ||||
| Ohio | 11 | 0 | 11 | -7 | 18 | ||||
| Oklahoma | 66 | -10 | 76 | -70 | 136 | ||||
| Pennsylvania | 36 | 0 | 36 | -8 | 44 | ||||
| Texas | 423 | -7 | 430 | -108 | 531 | ||||
| Utah | 3 | -3 | 6 | -2 | 5 | ||||
| West Virginia | 16 | 0 | 16 | 3 | 13 | ||||
| Wyoming | 35 | -1 | 36 | 5 | 30 | ||||
| Major Basin Variances | This Week | +/- | Last Week | +/- | Year Ago | ||||
| Ardmore Woodford | 2 | -1 | 3 | 0 | 2 | ||||
| Arkoma Woodford | 3 | -1 | 4 | -4 | 7 | ||||
| Barnett | 4 | 0 | 4 | 2 | 2 | ||||
| Cana Woodford | 36 | -3 | 39 | -24 | 60 | ||||
| DJ-Niobrara | 23 | 1 | 22 | -4 | 27 | ||||
| Eagle Ford | 63 | -3 | 66 | -16 | 79 | ||||
| Granite Wash | 3 | 0 | 3 | -11 | 14 | ||||
| Haynesville | 50 | 0 | 50 | 2 | 48 | ||||
| Marcellus | 50 | 0 | 50 | -5 | 55 | ||||
| Mississippian | 2 | 0 | 2 | -2 | 4 | ||||
| Permian | 417 | -2 | 419 | -71 | 488 | ||||
| Utica | 12 | 0 | 12 | -8 | 20 | ||||
| Williston | 53 | -2 | 55 | 0 | 53 | ||||
-----
Earlier:

2019, September, 19, 14:25:00
SAUDI ARABIA, U.S. COALITION
Saudi Arabia on Wednesday announced it has joined the International Maritime Security Construct to secure the Mideast's waterways.
2019, September, 19, 14:10:00
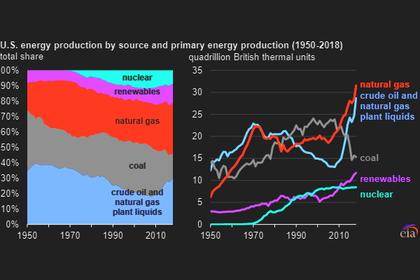
80%: U.S. FOSSIL FUELS ENERGY
The share of U.S. total energy consumption that originated from fossil fuels has fallen from its peak of 94% in 1966 to 80% in 2018. The total amount of fossil fuels consumed in the United States has also fallen from its peak of 86 quads in 2007. Since then, coal consumption decreased by 10 quads and petroleum by 2 quads, more than offsetting a 7 quad increase in natural gas consumption.
2019, September, 17, 12:55:00
2020: WORLD OIL DEMAND WILL UP BY 1.08 MBD
World oil demand in 2019 is expected to grow by 1.02 mb/d, which is 0.08 mb/d lower than last month’s projection. The drop can be attributed to weaker-than-expected data in 1H19 from various global demand centres and slower economic growth projections for the remainder of the year. Both OECD and non-OECD demand growth forecasts were revised lower, by 0.03 mb/d and 0.05 mb/d, respectively. In 2020, world oil demand is projected to increase by 1.08 mb/d.
2019, September, 17, 12:50:00
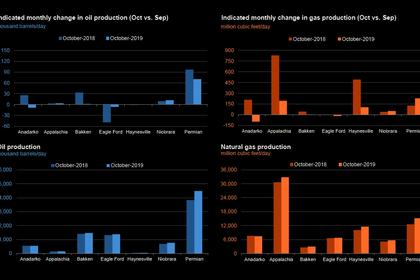
U.S. PRODUCTION: OIL + 74 TBD, GAS + 469 MCFD
U.S. EIA - Crude oil production from the major US onshore regions is forecast to increase 74,000 b/d month-over-month in September from 8,769 to 8,843 thousand barrels/day, gas production to increase 469 million cubic feet/day from 81,893 to 82,362 million cubic feet/day .
2019, September, 16, 14:10:00
U.S. RIGS DOWN 12 TO 886
U.S. Rig Count is down 12 rigs from last week to 886, with oil rigs down 5 to 733, gas rigs down 7 to 153, and miscellaneous rigs unchanged at 0. Canada Rig Count is down 13 rigs from last week to 134, with oil rigs down 9 to 93 and gas rigs down 4 to 41.
2019, September, 10, 17:05:00
U.S. RIGS DOWN 6 TO 898
U.S. Rig Count is down 6 rigs from last week to 898, with oil rigs down 4 to 738, gas rigs down 2 to 160, and miscellaneous rigs unchanged at 0. Canada Rig Count is down 3 rigs from last week to 147, with oil rigs down 3 to 102 and gas rigs unchanged at 45.
2019, September, 6, 13:50:00
U.S. SHALE OIL CUTTING
Bankruptcy filings by U.S. energy producers through mid-August this year have nearly matched the total for the whole of 2018. A stock index of oil and gas producers hit an all-time low in August, a sign investors are expecting more trouble ahead.


