2019-09-10 17:05:00
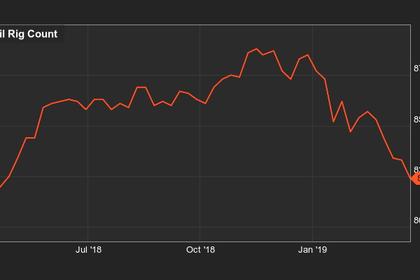
U.S. RIGS DOWN 6 TO 898
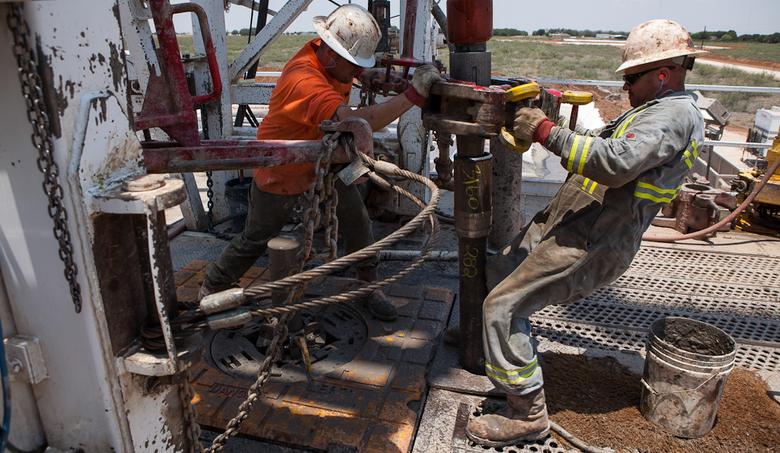
BHGE - U.S. Rig Count is down 6 rigs from last week to 898, with oil rigs down 4 to 738, gas rigs down 2 to 160, and miscellaneous rigs unchanged at 0.
U.S. Rig Count is down 150 rigs from last year's count of 1,048, with oil rigs down 122, gas rigs down 26, and miscellaneous rigs down 2 to 0.
The U.S. Offshore Rig Count is unchanged at 28 and up 9 rigs year-over-year.
Canada Rig Count is down 3 rigs from last week to 147, with oil rigs down 3 to 102 and gas rigs unchanged at 45.
Canada Rig Count is down 57 rigs from last year's count of 204, with oil rigs down 31 and gas rigs down 26.
| Rotary Rig Count | |||||||||
| 9/6/19 | |||||||||
| Week | Year | ||||||||
| Location | Week | +/- | Ago | +/- | Ago | ||||
| Land | 870 | -6 | 876 | -156 | 1026 | ||||
| Inland Waters | 0 | 0 | 0 | -3 | 3 | ||||
| Offshore | 28 | 0 | 28 | 9 | 19 | ||||
| United States Total | 898 | -6 | 904 | -150 | 1048 | ||||
| Gulf Of Mexico | 26 | 0 | 26 | 9 | 17 | ||||
| Canada | 147 | -3 | 150 | -57 | 204 | ||||
| North America | 1045 | -9 | 1054 | -207 | 1252 | ||||
| U.S. Breakout Information | This Week | +/- | Last Week | +/- | Year Ago | ||||
| Oil | 738 | -4 | 742 | -122 | 860 | ||||
| Gas | 160 | -2 | 162 | -26 | 186 | ||||
| Miscellaneous | 0 | 0 | 0 | -2 | 2 | ||||
| Directional | 67 | -3 | 70 | 2 | 65 | ||||
| Horizontal | 783 | -1 | 784 | -135 | 918 | ||||
| Vertical | 48 | -2 | 50 | -17 | 65 | ||||
| Canada Breakout Information | This Week | +/- | Last Week | +/- | Year Ago | ||||
| Oil | 102 | -3 | 105 | -31 | 133 | ||||
| Gas | 45 | 0 | 45 | -26 | 71 | ||||
| Major State Variances | This Week | +/- | Last Week | +/- | Year Ago | ||||
| Alaska | 8 | -1 | 9 | 2 | 6 | ||||
| California | 18 | 0 | 18 | 3 | 15 | ||||
| Colorado | 27 | 0 | 27 | -3 | 30 | ||||
| Louisiana | 60 | 0 | 60 | 2 | 58 | ||||
| New Mexico | 108 | 0 | 108 | 8 | 100 | ||||
| North Dakota | 54 | 3 | 51 | 1 | 53 | ||||
| Ohio | 12 | 0 | 12 | -9 | 21 | ||||
| Oklahoma | 75 | -5 | 80 | -62 | 137 | ||||
| Pennsylvania | 34 | 0 | 34 | -7 | 41 | ||||
| Texas | 438 | -3 | 441 | -90 | 528 | ||||
| Utah | 6 | 0 | 6 | 1 | 5 | ||||
| West Virginia | 19 | 0 | 19 | 6 | 13 | ||||
| Wyoming | 36 | 0 | 36 | 5 | 31 | ||||
| Major Basin Variances | This Week | +/- | Last Week | +/- | Year Ago | ||||
| Ardmore Woodford | 3 | 0 | 3 | 1 | 2 | ||||
| Arkoma Woodford | 4 | 0 | 4 | -3 | 7 | ||||
| Barnett | 1 | 0 | 1 | -1 | 2 | ||||
| Cana Woodford | 42 | -3 | 45 | -24 | 66 | ||||
| DJ-Niobrara | 23 | 0 | 23 | -2 | 25 | ||||
| Eagle Ford | 67 | 0 | 67 | -11 | 78 | ||||
| Granite Wash | 3 | 0 | 3 | -10 | 13 | ||||
| Haynesville | 49 | 0 | 49 | 1 | 48 | ||||
| Marcellus | 52 | 0 | 52 | -1 | 53 | ||||
| Mississippian | 2 | -1 | 3 | -1 | 3 | ||||
| Permian | 427 | -2 | 429 | -57 | 484 | ||||
| Utica | 13 | 0 | 13 | -9 | 22 | ||||
| Williston | 54 | 3 | 51 | 1 | 53 | ||||
-----
Earlier:
2019, September, 6, 13:50:00
U.S. SHALE OIL CUTTING
Bankruptcy filings by U.S. energy producers through mid-August this year have nearly matched the total for the whole of 2018. A stock index of oil and gas producers hit an all-time low in August, a sign investors are expecting more trouble ahead.
2019, September, 4, 17:55:00
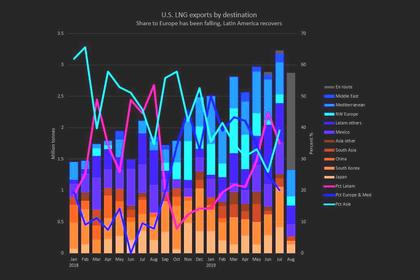
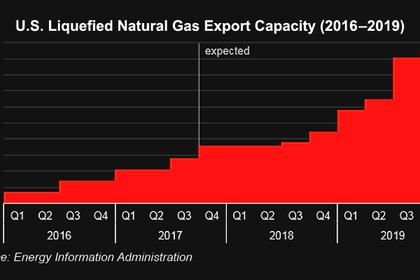
U.S. LNG UP TO 10%
U.S. exports of liquefied natural gas (LNG now amount to 10% of the global market and at 22 million tonnes so far this year are equal to the total volumes pumped out in 2018,
2019, September, 2, 13:05:00
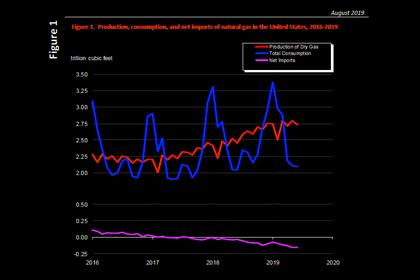
U.S. GAS PRODUCTION UP 11.5%
In June 2019, for the 26th consecutive month, dry natural gas production increased year to year for the month. The preliminary level for dry natural gas production in June 2019 was 2,735 billion cubic feet (Bcf), or 91.2 Bcf/d. This level was 9.4 Bcf/d (11.5%) higher than the June 2018 level of 81.8 Bcf/d.

2019, September, 2, 12:15:00
U.S. RIGS DOWN 12 TO 904
U.S. Rig Count is down 12 rigs from last week to 904, with oil rigs down 12 to 742, gas rigs unchanged at 162, and miscellaneous rigs unchanged at 0. Canada Rig Count is up 11 rigs from last week to 150, with oil rigs up 10 to 105 and gas rigs up 1 to 45.
2019, August, 30, 10:35:00
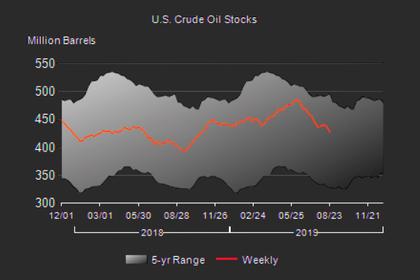
U.S. OIL INVENTORIES 427.8 MLN BBL
At 427.8 million bbl, US crude oil inventories are at the 5-year average for this time of year

2019, August, 28, 12:40:00
U.S., CHINA ESCALATION: $550 BLN
The US will raise the tariff on $250 billion worth of Chinese imports from 25% to 30% on October 1, and raise the current 10% tariff on another $300 billion of Chinese imports to 15% on September 1,
2019, August, 28, 12:35:00
U.S. LNG FOR LATIN AMERICA UP
Feedgas flows to US LNG export terminals reached a new record of 6.5 Bcf/d on Friday, subject to revisions, amid robust demand in Latin America and positive netback spreads that are expected to strengthen into October,


