2019-09-20 15:10:00


U.S. TRADE DEFICIT DOWN TO $128.2 BLN
U.S. BEA - SEPTEMBER 19, 2019 - The U.S. current account deficit, which reflects the combined balances on trade in goods and services and income flows between U.S. residents and residents of other countries, narrowed by $8.0 billion, or 5.9 percent, to $128.2 billion in the second quarter of 2019, according to statistics from the U.S. Bureau of Economic Analysis (BEA). The revised first quarter deficit was $136.2 billion.
The second quarter deficit was 2.4 percent of current dollar gross domestic product, down from 2.6 percent in the first quarter.
The $8.0 billion narrowing of the current account deficit in the second quarter mainly reflected an expanded surplus on primary income.

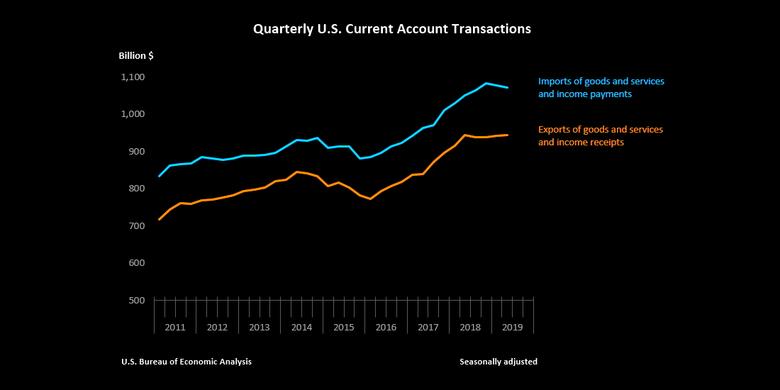
Current Account Transactions (tables 1-5)
Exports of goods and services to, and income received from, foreign residents increased $2.1 billion, to $943.0 billion, in the second quarter. Imports of goods and services from, and income paid to, foreign residents decreased $5.9 billion, to $1.07 trillion.
Trade in Goods (table 2)
Exports of goods decreased $4.5 billion, to $414.6 billion, mainly reflecting a decrease in capital goods, mostly civilian aircraft. Imports of goods increased $2.0 billion, to $637.9 billion, led by an increase in industrial supplies and materials. Changes in the other major categories were nearly offsetting.
Trade in Services (table 3)
Exports of services decreased $0.1 billion, to $207.8 billion, reflecting nearly offsetting changes across major categories. Decreases were led by travel, mainly other personal travel, and increases were led by other business services, mainly professional and management consulting services. Imports of services increased $0.2 billion, to $147.8 billion, also reflecting nearly offsetting changes across major categories. Increases were led by insurance services, mainly reinsurance, and decreases were led by transport, mostly sea freight transport.
Primary Income (table 4)
Receipts of primary income increased $7.1 billion, to $285.2 billion, mostly reflecting increases in portfolio investment income, mainly dividends on equity securities, and in direct investment income. Within direct investment income, dividends were $88.3 billion in the second quarter and remain elevated since the passage of the 2017 Tax Cuts and Jobs Act, which generally eliminated taxes on repatriated earnings beginning in 2018. For more information, see “How do the effects of the 2017 Tax Cuts and Jobs Act appear in BEA’s direct investment statistics?” Payments of primary income decreased $3.7 billion, to $217.6 billion, mostly reflecting a decrease in direct investment income.
Secondary Income (table 5)
Receipts of secondary income decreased $0.3 billion, to $35.5 billion. Payments of secondary income decreased $4.5 billion, to $67.9 billion, mostly reflecting decreases in U.S. government grants and in private sector payments of fines and penalties.
Financial Account Transactions (tables 1, 6, 7, and 8)
Net financial account transactions were −$155.1 billion in the second quarter, reflecting net U.S. borrowing from foreign residents.
Financial Assets
Second quarter transactions increased U.S. residents’ foreign financial assets by $208.2 billion. Transactions increased direct investment assets, primarily equity, by $86.0 billion; portfolio investment assets, mainly long-term debt securities, by $38.2 billion; other investment assets, primarily currency and deposits, by $81.6 billion; and reserve assets by $2.4 billion.
Liabilities
Second quarter transactions increased U.S. liabilities to foreign residents by $354.1 billion. Transactions increased direct investment liabilities, mostly equity, by $81.2 billion; portfolio investment liabilities, both equity and debt securities, by $167.5 billion; and other investment liabilities, mostly bank deposits, by $105.5 billion.
Financial Derivatives
Net transactions in financial derivatives were −$9.2 billion in the second quarter, reflecting net borrowing from foreign residents.
| Updates to First Quarter 2019 International Transactions Accounts Balances Billions of dollars, seasonally adjusted |
||
| Preliminary estimate | Revised estimate | |
| Current account balance | −130.4 | −136.2 |
| Goods balance | −216.5 | −216.7 |
| Services balance | 61.9 | 60.3 |
| Primary income balance | 61.1 | 56.9 |
| Secondary income balance | −36.9 | −36.6 |
| Net financial account transactions | −37.8 | −36.7 |
-----


