2019-09-04 17:50:00
U.S. TRADE DEFICIT UPDOWN
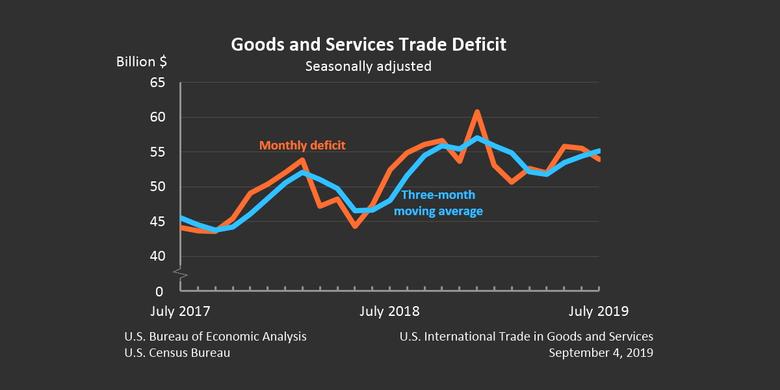
U.S. BEA - The U.S. Census Bureau and the U.S. Bureau of Economic Analysis announced today that the goods and services deficit was $54.0 billion in July, down $1.5 billion from $55.5 billion in June, revised.
| Deficit: | $54.0 Billion | -2.7%° |
| Exports: | $207.4 Billion | +0.6%° |
| Imports: | $261.4 Billion | -0.1%° |
|
Next release: October 4, 2019 (°) Statistical significance is not applicable or not measurable. Data adjusted for seasonality but not price changes Source: U.S. Census Bureau, U.S. Bureau of Economic Analysis; U.S. International Trade in Goods and Services, September 4, 2019 |
||
Exports, Imports, and Balance
July exports were $207.4 billion, $1.2 billion more than June exports. July imports were $261.4 billion, $0.4 billion less than June imports.
The July decrease in the goods and services deficit reflected a decrease in the goods deficit of $1.6 billion to $73.7 billion and a decrease in the services surplus of $0.1 billion to $19.7 billion.
Year-to-date, the goods and services deficit increased $28.2 billion, or 8.2 percent, from the same period in 2018. Exports decreased $3.4 billion or 0.2 percent. Imports increased $24.9 billion or 1.4 percent.
Three-Month Moving Averages
The average goods and services deficit increased $0.7 billion to $55.1 billion for the three months ending in July.
- Average exports increased $0.5 billion to $208.0 billion in July.
- Average imports increased $1.2 billion to $263.1 billion in July.
Year-over-year, the average goods and services deficit increased $7.0 billion from the three months ending in July 2018.
- Average exports decreased $3.0 billion from July 2018.
- Average imports increased $4.0 billion from July 2018.
Exports
Exports of goods increased $1.2 billion to $138.2 billion in July.
Exports of goods on a Census basis increased $1.2 billion.
- Consumer goods increased $1.5 billion.
- Pharmaceutical preparations increased $1.2 billion.
- Capital goods increased $0.8 billion.Automotive vehicles, parts, and engines increased $0.6 billion.
- Industrial supplies and materials decreased $1.7 billion.
- Crude oil decreased $0.5 billion.
- Metallurgical grade coal decreased $0.2 billion.
- Fuel oil decreased $0.2 billion.
- Other petroleum products decreased $0.2 billion.
Net balance of payments adjustments increased $0.1 billion.
Exports of services decreased $0.1 billion to $69.2 billion in July.
- Transport decreased $0.1 billion.
- Charges for the use of intellectual property decreased $0.1 billion.
- Other business services, which includes research and development services; professional and management services; and technical, trade-related, and other services, increased $0.1 billion.
Imports
Imports of goods decreased $0.4 billion to $211.8 billion in July.
Imports of goods on a Census basis decreased $0.6 billion.
- Capital goods decreased $1.5 billion.
- Computers decreased $1.4 billion.
- Industrial supplies and materials increased $0.9 billion.
- Other petroleum products increased $1.0 billion.
Net balance of payments adjustments increased $0.1 billion.
Imports of services increased $0.1 billion to $49.6 billion in July.
- Insurance services increased $0.1 billion.
- Other business services increased $0.1 billion.
- Transport decreased $0.1 billion.
Real Goods in 2012 Dollars – Census Basis
The real goods deficit decreased $0.7 billion to $85.5 billion in July.
- Real exports of goods increased $0.6 billion to $148.7 billion.
- Real imports of goods decreased $0.1 billion to $234.2 billion.
Revisions
Exports and imports of goods and services were revised for January through June 2019 to incorporate more comprehensive and updated quarterly and monthly data.
Revisions to June exports
- Exports of goods were revised down $0.2 billion.
- Exports of services were revised up $0.1 billion.
Revisions to June imports
- Imports of goods were revised down less than $0.1 billion.
- Imports of services were revised up $0.3 billion.
Goods by Selected Countries and Areas: Monthly – Census Basis
The July figures show surpluses, in billions of dollars, with South and Central America ($3.7), Hong Kong ($2.4), Brazil ($0.7), United Kingdom ($0.3), OPEC ($0.3), and Singapore ($0.1). Deficits were recorded, in billions of dollars, with China ($29.6), European Union ($15.9), Mexico ($8.9), Germany ($6.2), Japan ($5.9), Italy ($3.1), Canada ($3.1), India ($2.1), Taiwan ($2.0), France ($1.9), South Korea ($1.5), and Saudi Arabia (less than $0.1).
- The balance with members of OPEC shifted from a deficit of $0.3 billion to a surplus of $0.3 billion in July. Exports decreased $0.3 billion to $3.6 billion and imports decreased $0.8 billion to $3.3 billion.
- The deficit with China decreased $0.5 billion to $29.6 billion in July. Exports decreased $0.3 billion to $9.3 billion and imports decreased $0.8 billion to $39.0 billion.
- The surplus with South and Central America decreased $1.1 billion to $3.7 billion in July. Exports decreased $0.9 billion to $13.0 billion and imports increased $0.2 billion to $9.3 billion.
Goods and Services by Selected Countries and Areas: Quarterly – Balance of Payments Basis
Statistics on trade in goods and services by country and area are only available quarterly, with a one-month lag. With this release, second-quarter figures are now available.
The second-quarter figures show surpluses, in billions of dollars, with South and Central America ($20.4), Hong Kong ($8.1), Brazil ($7.5), Singapore ($4.6), OPEC ($3.9), United Kingdom ($3.2), and Saudi Arabia ($1.4). Deficits were recorded, in billions of dollars, with China ($80.6), European Union ($35.1), Mexico ($26.1), Germany ($16.8), Japan ($16.3), Italy ($9.3), India ($5.8), France ($5.2), Taiwan ($4.7), Canada ($3.3), and South Korea ($2.0).
- The deficit with the European Union increased $7.6 billion to $35.1 billion in the second quarter. Exports decreased $5.6 billion to $146.5 billion and imports increased $2.0 billion to $181.6 billion.
- The balance with Canada shifted from a surplus of $3.9 billion to a deficit of $3.3 billion in the second quarter. Exports decreased $1.4 billion to $89.3 billion and imports increased $5.7 billion to $92.6 billion.
- The deficit with South Korea decreased $2.5 billion to $2.0 billion in the second quarter. Exports increased $0.5 billion to $19.9 billion and imports decreased $2.0 billion to $21.9 billion.
-----
Earlier:
2019, August, 30, 10:20:00
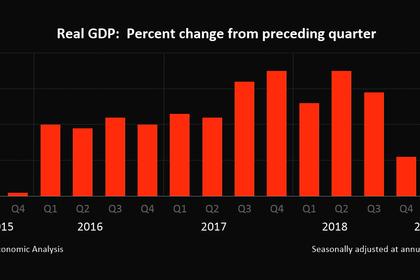
U.S. GDP UP 2%
U.S. Real gross domestic product (GDP) increased at an annual rate of 2.0 percent in the second quarter of 2019, according to the "second" estimate released by the Bureau of Economic Analysis. In the first quarter, real GDP increased 3.1 percent.

2019, August, 23, 11:05:00
U.S., UK, AUSTRALIA CAN CLOSE HORMUZ
Foremost among the areas to be patrolled is the Strait of Hormuz, between Oman and Iran, through which about one-fifth of the world’s seaborne crude flows out of the Gulf.
2019, August, 19, 11:25:00
U.S. SECURITIES ACQUISITIONS $1.7 BLN
The sum total in June of all net foreign acquisitions of long-term securities, short-term U.S. securities, and banking flows was a net TIC inflow of $1.7 billion. Of this, net foreign private inflows were $6.1 billion, and net foreign official outflows were $4.5 billion.
2019, August, 16, 10:15:00
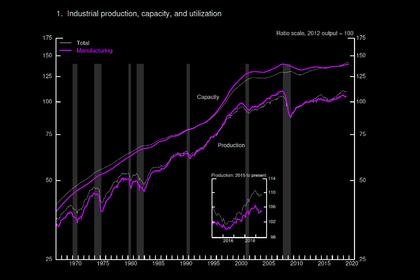
U.S. INDUSTRIAL PRODUCTION DOWN
Industrial production declined 0.2 percent in July. Manufacturing output decreased 0.4 percent last month and has fallen more than 1-1/2 percent since December 2018. In July, mining output fell 1.8 percent, as Hurricane Barry caused a sharp but temporary decline in oil extraction in the Gulf of Mexico.


