2020-01-22 12:50:00
U.S. PRODUCTION: OIL + 22 TBD, GAS + 65 MCFD
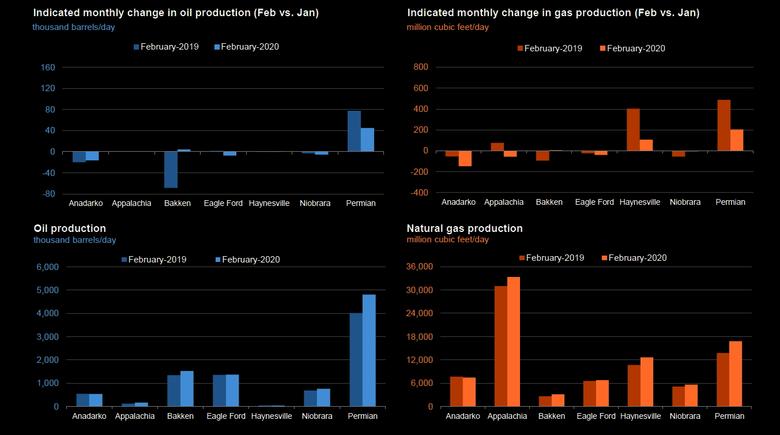
U.S. EIA - Crude oil production from the major US onshore regions is forecast to increase 22,000 b/d month-over-month in January from 9,178 to 9,200 thousand barrels/day, gas production to increase 65 million cubic feet/day from 85,920 to 85,985 million cubic feet/day .
| Oil production thousand barrels/day |
Gas production million cubic feet/day |
|||||
| Region | January 2020 | February 2020 | change | January 2020 | February 2020 | change |
| Anadarko | 551 | 535 | (16) | 7,643 | 7,495 | (148) |
| Appalachia | 166 | 166 | - | 33,402 | 33,346 | (56) |
| Bakken | 1,521 | 1,526 | 5 | 3,174 | 3,178 | 4 |
| Eagle Ford | 1,376 | 1,369 | (7) | 6,843 | 6,804 | (39) |
| Haynesville | 40 | 40 | - | 12,586 | 12,691 | 105 |
| Niobrara | 766 | 761 | (5) | 5,639 | 5,633 | (6) |
| Permian | 4,758 | 4,803 | 45 | 16,633 | 16,838 | 205 |
| Total | 9,178 | 9,200 | 22 | 85,920 | 85,985 | 65 |
| New-well oil production per rig barrels/day |
New-well gas production per rig thousand cubic feet/day |
|||||
| Region | January 2020 | February 2020 | change | January 2020 | February 2020 | change |
| Anadarko | 627 | 647 | 20 | 4,305 | 4,412 | 107 |
| Appalachia | 164 | 166 | 2 | 18,761 | 18,752 | (9) |
| Bakken | 1,559 | 1,598 | 39 | 2,289 | 2,337 | 48 |
| Eagle Ford | 1,453 | 1,475 | 22 | 4,916 | 4,926 | 10 |
| Haynesville | 26 | 27 | 1 | 10,310 | 10,335 | 25 |
| Niobrara | 1,220 | 1,225 | 5 | 4,233 | 4,255 | 22 |
| Permian | 808 | 810 | 2 | 1,562 | 1,567 | 5 |
| Rig-weighted average | 840 | 848 | 8 | 4,093 | 4,142 | 49 |
| Drilled but uncompleted wells (DUC) | |||
| Region | November 2019 | December 2019 | change |
| Anadarko | 686 | 632 | -54 |
| Appalachia | 448 | 427 | -21 |
| Bakken | 795 | 813 | 18 |
| Eagle Ford | 1,442 | 1,427 | -15 |
| Haynesville | 208 | 214 | 6 |
| Niobrara | 446 | 448 | 2 |
| Permian | 3,598 | 3,612 | 14 |
| Total | 7,623 | 7,573 | -50 |
-----
Earlier:
2020, January, 15, 12:40:00
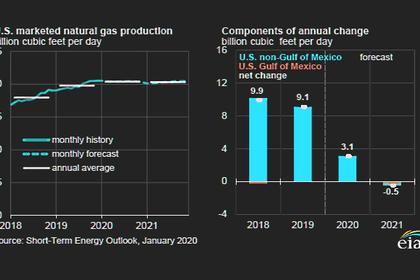
U.S. GAS WILL DOWN
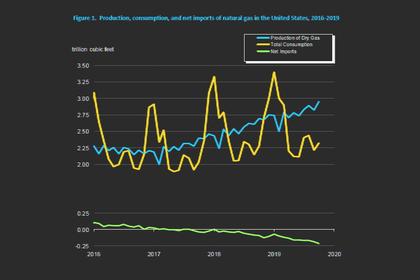
U.S. dry gas production will fall to 94.11 billion cubic feet per day (bcfd) in 2021 from a record 94.74 bcfd in 2020. The current all-time high is 92.03 bcfd in 2019.
2020, January, 10, 11:30:00
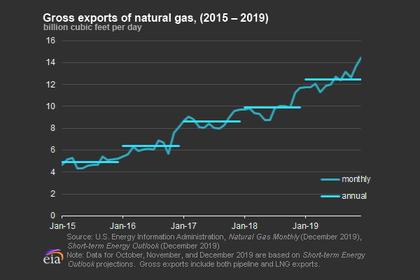
U.S. GAS UP
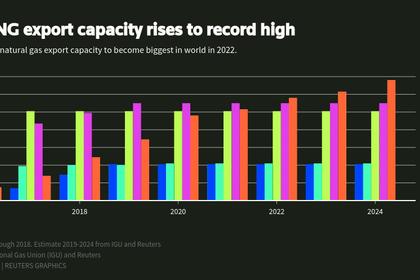
U.S. natural gas exports reached new highs in 2019, driven by LNG exports.
2020, January, 10, 11:25:00
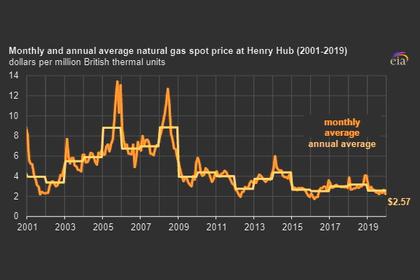
U.S. GAS PRICES DOWN
In 2019, natural gas spot prices at the national benchmark Henry Hub in Louisiana averaged $2.57 per million British thermal units (MMBtu), about 60 cents per MMBtu lower than in 2018 and the lowest annual average price since 2016.
2020, January, 8, 14:30:00
U.S. LNG NEED INVESTMENT
Aramco has vowed to pump almost $160 billion into growth in the natural gas sector over the next decade, with a sizable portion of that money to be designated for LNG projects overseas.
2020, January, 6, 10:50:00
U.S. GAS PRODUCTION UP TO 2,952 BCF
The preliminary level for dry natural gas production in October 2019 was 2,952 billion cubic feet (Bcf), or 95.2 Bcf/d.


