2020-01-06 10:50:00


U.S. GAS PRODUCTION UP TO 2,952 BCF
U.S.EIA - Natural Gas Monthly
October 2019
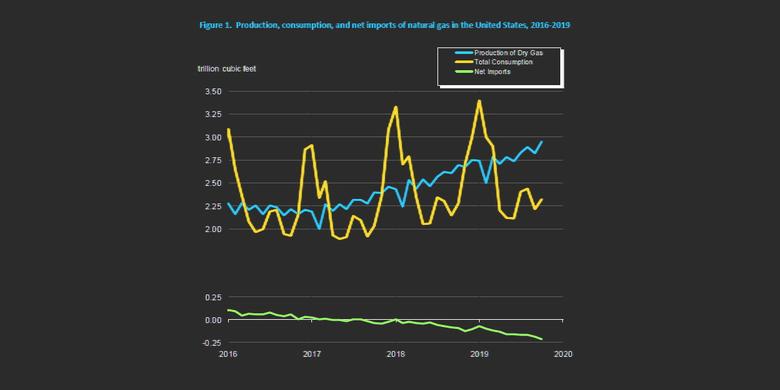
- In October 2019, for the 30th consecutive month, dry natural gas production increased year to year for the month. The preliminary level for dry natural gas production in October 2019 was 2,952 billion cubic feet (Bcf), or 95.2 Bcf/d. This level was 8.2 Bcf/d (9.4%) higher than the October 2018 level of 87.0 Bcf/d. The average daily rate of dry production was the highest for any month since EIA began tracking monthly dry production in 1997.
- The estimated natural gas consumption in October 2019 was 2,327 Bcf, or 75.1 Bcf/d. This level was 1.5 Bcf/d (2.1%) higher than the 73.5 Bcf/d consumed in October 2018. Natural gas consumption for October was the highest level for the month since 2001, when EIA began using the current definitions for consuming sectors.
- Year-over-year total consumption of dry natural gas in October 2019 increased in two of the four consuming sectors, and it decreased in the other two sectors. Deliveries of natural gas by consuming sector in October 2019 were:
- Residential deliveries: 233 Bcf for the month, or 7.5 Bcf/d
• Down 8.6% compared with 8.2 Bcf/d in October 2018. - Commercial deliveries: 218 Bcf for the month, or 7.0 Bcf/d • Down 8.0% compared with 7.6 Bcf/d in October 2018. Despite this decrease, commercial deliveries were the second highest for the month since EIA began tracking them in 1973.
- Industrial deliveries: 681.6 Bcf for the month, or 21.99 Bcf/d • Up 0.05% compared with 21.98 Bcf/d in October 2018. Industrial deliveries were the highest for the month since EIA began using the current definitions for consuming sectors in 2001.
- Electric power deliveries: 960 Bcf for the month, or 31.0 Bcf/d • Up 8.1% compared with 28.6 Bcf/d in October 2018. Electric power deliveries were the highest for the month since EIA began using the current definitions for consuming sectors in 2001.
- Residential deliveries: 233 Bcf for the month, or 7.5 Bcf/d
- Net natural gas imports (imports minus exports) were -214 Bcf, or -6.9 Bcf/d, in October 2019, making the United States a net exporter. Natural gas imports and exports in October 2019 were:
- Total imports: 211 Bcf for the month, or 6.8 Bcf/d
• Down 1.9% compared with 6.9 Bcf/d in October 2018. - Total exports: 425 Bcf for the month, or 13.7 Bcf/d • Up 38.4% compared with 9.9 Bcf/d in October 2018. Natural gas exports were the highest for any month since EIA began tracking monthly exports in 1973. Liquefied natural gas (LNG) continues to drive the year-on-year increase in exports. LNG exports in October 2019 were 97.8% higher than in October 2018. In October 2019, the United States exported 5.7 Bcf/d of LNG to 22 countries. LNG exports were the highest for any month since EIA began tracking them in 1997.
- Total imports: 211 Bcf for the month, or 6.8 Bcf/d
-----
Earlier:

2019, December, 30, 10:55:00
U.S. RIGS DOWN 8 TO 805
U.S. Rig Count is down 8 rigs from last week to 805, Canada Rig Count is down 50 rigs from last week to 99
2019, December, 27, 10:25:00
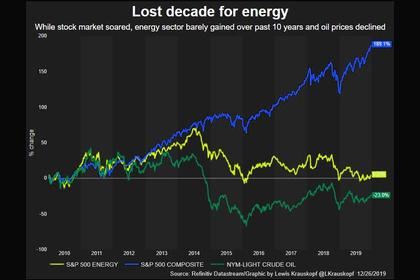
U.S. ENERGY LOST
“It really is a great irony that at a time when the United States became the world’s biggest producer and has become a great exporter, that investors have become skeptical and have adopted a position of ‘show me the money,’”
2019, December, 18, 13:10:00
U.S. PRODUCTION: OIL + 30 TBD, GAS + 77 MCFD
Crude oil production from the major US onshore regions is forecast to increase 30,000 b/d month-over-month in December from 9,105 to 9,135 thousand barrels/day, gas production to increase 77 million cubic feet/day from 85,521 to 85,598 million cubic feet/day .


