2020-01-10 11:30:00


U.S. GAS UP
U.S. EIA - January 9, 2020 - Natural Gas Weekly Update
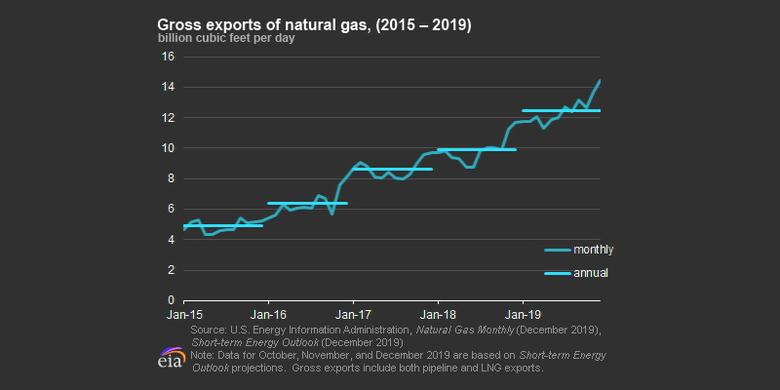
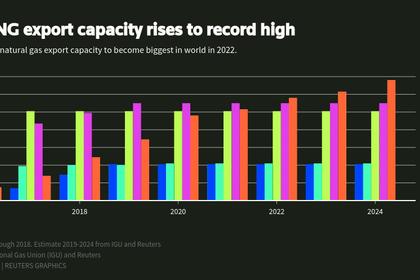
Natural gas exports reached new highs in 2019, driven by LNG exports. Strong growth in exports of natural gas occurred, driven by record exports of liquefied natural gas (LNG). Several new LNG export facilities came online in 2019: the first train at Cameron LNG in May; the first and second trains at Freeport LNG in September and December, respectively; and the first five Moveable Modular Liquefaction System (MMLS) units at Elba Island LNG in December. Relatively low-cost natural gas supported exports of domestically produced natural gas. The United States has been a net exporter of natural gas for more than a year. EIA projects the United States will continue to be a net exporter through 2050 as a result of expected growth in both pipeline and LNG exports.
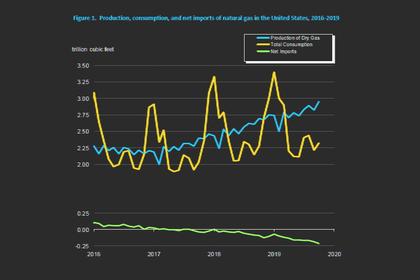
Natural gas production reached new highs in 2019. Similar to 2018, 2019 showed record levels of natural gas production, driven by growth in the Permian, Appalachian, and Haynesville Basins. Substantial new pipeline capacity supported the increased production, particularly in the Permian Basin, where prices were extremely low because the region did not have the pipeline capacity move natural gas out of the region. Much of the recent production growth is attributable to associated natural gas (natural gas that is produced from crude oil wells), which drove continued growth despite a somewhat unfavorable price environment.
Natural gas consumption in the electric power sector (power burn) reached new highs in 2019. During the summer of 2019, power burn also set several daily records. Lower natural gas prices led to increased natural gas consumption by power plants. In addition, the power sector added substantial natural gas-fired generation capacity in 2019, continuing the significant increase in capacity in 2018. The power sector has been trending toward more natural gas combined-cycle plants and renewable energy sources and fewer coal- and natural gas-fired plants that use older and less efficient technology. EIA forecasts that power burn will reach record highs in 2019, following similar record levels in 2018.


Overview:
(For the week ending Wednesday, January 8, 2019)
- Natural gas spot prices rose at most locations this report week (Wednesday, January 1 to Wednesday, January 8). The Henry Hub spot price rose from $2.05 per million British thermal units (MMBtu) last Wednesday to $2.08/MMBtu yesterday.
- At the New York Mercantile Exchange (Nymex), the price of the February 2020 contract increased 2¢, from $2.122/MMBtu last Thursday to $2.141/MMBtu yesterday. The price of the 12-month strip averaging February 2020 through January 2021 futures contracts climbed 3¢/MMBtu to $2.319/MMBtu.
- The net withdrawal from working gas totaled 44 billion cubic feet (Bcf) for the week ending January 3. Working natural gas stocks total 3,148 Bcf, which is 20% more than the year-ago level and 2% more than the five-year (2015–19) average for this week.
- The natural gas plant liquids composite price at Mont Belvieu, Texas, fell by 18¢/MMBtu, averaging $5.07/MMBtu for the week ending January 8. The prices of ethane and propane fell by 15% and 3%, respectively. The prices of butane and isobutane rose by 3% and 2%, respectively. The price of natural gasoline remained flat week over week.
- According to Baker Hughes, for the week ending Tuesday, December 31, the natural gas rig count decreased by 2 to 123. The number of oil-directed rigs fell by 7 to 670. The total rig count decreased by 9, and it now stands at 796.


Prices/Supply/Demand:
Henry Hub prices are the lowest they have been at the start of the year in a decade. This report week (Wednesday, January 1 to Wednesday, January 8), the Henry Hub spot price rose 3¢ from $2.05/MMBtu last Wednesday to $2.08/MMBtu yesterday, after reaching a low of $2.00/MMBtu on January 2. This spot price is the lowest for the first day of January trading since 2016. Although still cold, temperatures were significantly warmer than normal across the Lower 48 states, especially compared with the first week of January last year when temperatures were unseasonably cold. At the Chicago Citygate, the price increased 2¢ from $1.95/MMBtu last Wednesday to $1.97/MMBtu yesterday.
Most of Puerto Rico is without power after earthquakes damage key power plants. A 6.4 magnitude earthquake struck offshore of southwest Puerto Rico on Tuesday, creating power outages across most of the island. As of this morning, power had been restored to approximately one-third of the Puerto Rico Electric Power Authority (PREPA)’s 1.5 million customers.
The earthquakes and aftershocks have impacted two of Puerto Rico’s five power plants, both located on the southern coast: the natural gas-fired Costa Sur and the petroleum-fired Aguirre, according to PREPA. Almost two-thirds of Puerto Rico’s electricity generation capacity is located in the southern part of the island.
Aguirre is in the process of returning to service. Costa Sur sustained damage to the plant and its water tanks and will likely be out of service for a year, according to PREPA’s CEO. In 2018, Costa Sur generated more than three million megawatthours of electricity, or approximately 20% of the island’s power generation. In 2018, Puerto Rico imported an average of 166 million cubic feet per day (MMcf/d) of LNG exclusively from Trinidad through long-term contracts.
Northeast prices rise and remain at a premium to Henry Hub with seasonally cold weather. At the Algonquin Citygate, which serves Boston-area consumers, the price went up 55¢ from $2.36/MMBtu last Wednesday to $2.91/MMBtu yesterday. At the Transcontinental Pipeline Zone 6 trading point for New York City, the price increased 14¢ from $2.03/MMBtu last Wednesday to $2.17/MMBtu yesterday.
The Tennessee Zone 4 Marcellus spot price decreased 5¢ from $1.75/MMBtu last Wednesday to $1.70/MMBtu yesterday. The price at Dominion South in southwest Pennsylvania rose 2¢ from $1.69/MMBtu last Wednesday to $1.71/MMBtu yesterday.
California prices are mixed. The price at PG&E Citygate in Northern California rose 10¢, up from $3.22/MMBtu last Wednesday to a high of $3.32/MMBtu yesterday. The price at SoCal Citygate in Southern California decreased $1.25 from a high of $6.05/MMBtu last Wednesday to a low of $4.80/MMBtu yesterday.
Discount at Permian Basin trading hub widens. The price at the Waha Hub in West Texas, which is located near Permian Basin production activities, averaged a high of $1.24/MMBtu last Wednesday, 81¢/MMBtu lower than the Henry Hub price. Yesterday, the price at the Waha Hub averaged $0.64/MMBtu, which was $1.44/MMBtu lower than the Henry Hub price.
Supply rises with increased imports from Canada. According to data from IHS Markit, the average total supply of natural gas rose by 1% compared with the previous report week. Dry natural gas production remained constant week over week. Average net imports from Canada increased by 28% from last week to meet weather-related demand in the Northeast.
Demand rises across all sectors. Total U.S. consumption of natural gas rose by 10% compared with the previous report week, according to data from IHS Markit, amid seasonally cold temperatures. Natural gas consumed for power generation climbed by 11% week over week. Industrial sector consumption increased by 2% week over week. In the residential and commercial sectors, consumption increased by 15%. Natural gas exports to Mexico increased 16% as natural gas demand for power generation increased following low demand during the holiday season.
U.S. LNG exports increase week over week. Nineteen LNG vessels (eight from Sabine Pass, five from Freeport, and two from Corpus Christi, Cove Point, and Cameron) with a combined LNG-carrying capacity of 68 Bcf departed the United States between January 2 and January 8, 2020, according to shipping data compiled by Bloomberg.
Storage:
The net withdrawal from storage totaled 44 Bcf for the week ending January 3, compared with the five-year (2015–19) average net withdrawal of 156 Bcf and last year's net withdrawal of 81 Bcf during the same week. Working natural gas stocks totaled 3,148 Bcf, which is 74 Bcf more than the five-year average and 521 Bcf more than last year at this time.
The average rate of withdrawal from storage is 7% lower than the five-year average so far in the withdrawal season (November through March). If the rate of withdrawal from storage matched the five-year average of 15.6 Bcf/d for the remainder of the withdrawal season, the total inventory would be 1,771 Bcf on March 31, which is 74 Bcf higher than the five-year average of 1,697 Bcf for that time of year.
According to The Desk survey of natural gas analysts, estimates of the weekly net change to working natural gas stocks ranged from a net withdrawal of 40 Bcf to 62 Bcf, with a median estimate of 51 Bcf.
More storage data and analysis can be found on the Natural Gas Storage Dashboard and the Weekly Natural Gas Storage Report.
-----
Earlier:
2020, January, 8, 14:30:00
U.S. LNG NEED INVESTMENT
Aramco has vowed to pump almost $160 billion into growth in the natural gas sector over the next decade, with a sizable portion of that money to be designated for LNG projects overseas.
2020, January, 6, 10:50:00
U.S. GAS PRODUCTION UP TO 2,952 BCF
The preliminary level for dry natural gas production in October 2019 was 2,952 billion cubic feet (Bcf), or 95.2 Bcf/d.
2019, December, 27, 10:25:00
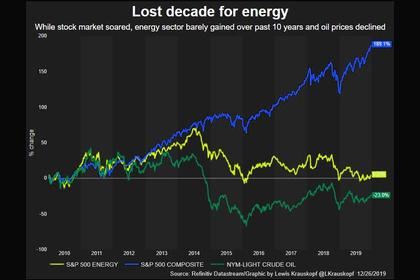
U.S. ENERGY LOST
“It really is a great irony that at a time when the United States became the world’s biggest producer and has become a great exporter, that investors have become skeptical and have adopted a position of ‘show me the money,’”
2019, December, 18, 13:10:00
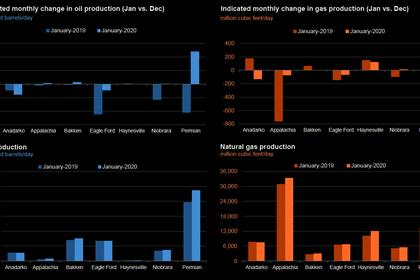
U.S. PRODUCTION: OIL + 30 TBD, GAS + 77 MCFD
Crude oil production from the major US onshore regions is forecast to increase 30,000 b/d month-over-month in December from 9,105 to 9,135 thousand barrels/day, gas production to increase 77 million cubic feet/day from 85,521 to 85,598 million cubic feet/day .


