2020-01-08 14:10:00


U.S. INTERNATIONAL TRADE DEFICIT $43.1 BLN
U.S. BEA - January 7, 2020 - U.S. International Trade in Goods and Services, November 2019
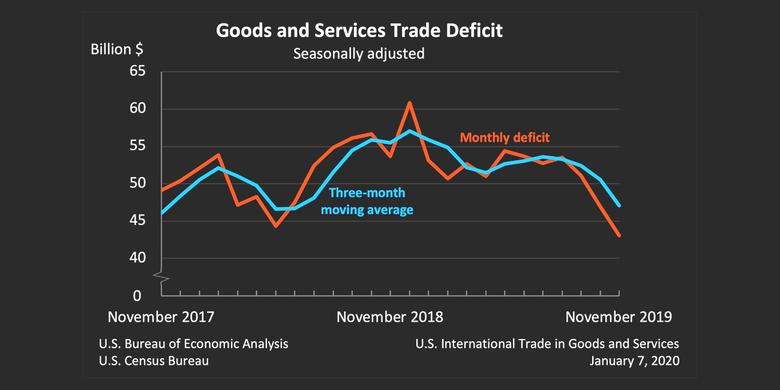
The U.S. Census Bureau and the U.S. Bureau of Economic Analysis announced today that the goods and services deficit was $43.1 billion in November, down $3.9 billion from $46.9 billion in October, revised.
| Deficit: | $43.1 Billion | -8.2%° |
| Exports: | $208.6 Billion | +0.7%° |
| Imports: | $251.7 Billion | -1.0%° |
|
Next release: February 5, 2020 (°) Statistical significance is not applicable or not measurable. Data adjusted for seasonality but not price changes Source: U.S. Census Bureau, U.S. Bureau of Economic Analysis; U.S. International Trade in Goods and Services, January 7, 2020 |
||
Exports, Imports, and Balance (exhibit 1)
November exports were $208.6 billion, $1.4 billion more than October exports. November imports were $251.7 billion, $2.5 billion less than October imports.
The November decrease in the goods and services deficit reflected a decrease in the goods deficit of $3.9 billion to $63.9 billion and a decrease in the services surplus of less than $0.1 billion to $20.8 billion.
Year-to-date, the goods and services deficit decreased $3.9 billion, or 0.7 percent, from the same period in 2018. Exports decreased less than $0.1 billion or less than 0.1 percent. Imports decreased $3.9 billion or 0.1 percent.
Three-Month Moving Averages (exhibit 2)
The average goods and services deficit decreased $3.5 billion to $47.0 billion for the three months ending in November.
- Average exports decreased $0.2 billion to $207.8 billion in November.
- Average imports decreased $3.7 billion to $254.9 billion in November.
Year-over-year, the average goods and services deficit decreased $8.4 billion from the three months ending in November 2018.
- Average exports decreased $1.5 billion from November 2018.
- Average imports decreased $9.9 billion from November 2018.
Exports (exhibits 3, 6, and 7)
Exports of goods increased $1.0 billion to $137.2 billion in November.
Exports of goods on a Census basis increased $1.0 billion.
- Capital goods increased $0.6 billion.
- Drilling and oilfield equipment increased $0.4 billion.
- Civilian aircraft engines increased $0.3 billion.
- Consumer goods increased $0.5 billion.
- Jewelry increased $0.4 billion.
- Gem diamonds increased $0.3 billion.
- Automotive vehicles, parts, and engines increased $0.4 billion.
- Other goods decreased $0.5 billion.
Net balance of payments adjustments decreased less than $0.1 billion.
Exports of services increased $0.4 billion to $71.5 billion in November.
- Other business services increased $0.1 billion.
- Transport increased $0.1 billion.
- Travel increased $0.1 billion.
Imports (exhibits 4, 6, and 8)
Imports of goods decreased $2.9 billion to $201.1 billion in November.
Imports of goods on a Census basis decreased $2.7 billion.
- Capital goods decreased $1.2 billion.
- Civilian aircraft decreased $0.6 billion.
- Computers decreased $0.6 billion.
- Consumer goods decreased $1.0 billion.
- Cell phones and other household goods decreased $0.5 billion.
- Artwork and other collectibles decreased $0.3 billion.
- Other goods decreased $0.8 billion.
- Industrial supplies and materials decreased $0.6 billion.
- Automotive vehicles, parts, and engines increased $1.1 billion.
- Automotive parts and accessories increased $0.5 billion.
- Trucks, buses, and special purpose vehicles increased $0.3 billion.
Net balance of payments adjustments decreased $0.2 billion.
Imports of services increased $0.4 billion to $50.7 billion in November.
- Travel increased $0.1 billion.
- Transport increased $0.1 billion.
Real Goods in 2012 Dollars – Census Basis (exhibit 11)
The real goods deficit decreased $3.7 billion to $75.3 billion in November.
- Real exports of goods increased $0.7 billion to $148.7 billion.
- Real imports of goods decreased $3.0 billion to $224.0 billion.
Revisions
Revisions to October exports
- Exports of goods were revised up $0.1 billion.
- Exports of services were revised up less than $0.1 billion.
Revisions to October imports
- Imports of goods were revised down $0.1 billion.
- Imports of services were revised up less than $0.1 billion.
Goods by Selected Countries and Areas: Monthly – Census Basis (exhibit 19)
The November figures show surpluses, in billions of dollars, with South and Central America ($4.9), Hong Kong ($1.8), Brazil ($1.7), United Kingdom ($1.3), OPEC ($0.7), Singapore ($0.6), and Saudi Arabia ($0.1). Deficits were recorded, in billions of dollars, with China ($25.6), European Union ($13.5), Mexico ($8.5), Japan ($5.7), Germany ($5.2), India ($2.4), Italy ($2.3), Taiwan ($1.7), Canada ($1.7), South Korea ($1.2), and France ($1.2).
- The deficit with China decreased $2.2 billion to $25.6 billion in November. Exports increased $1.4 billion to $8.9 billion and imports decreased $0.8 billion to $34.5 billion.
- The deficit with Canada decreased $1.6 billion to $1.7 billion in November. Exports increased $0.1 billion to $24.0 billion and imports decreased $1.5 billion to $25.7 billion.
- The deficit with Japan increased $1.3 billion to $5.7 billion in November. Exports decreased $0.6 billion to $5.8 billion and imports increased $0.7 billion to $11.6 billion.
-----
Earlier:
2019, December, 27, 10:25:00
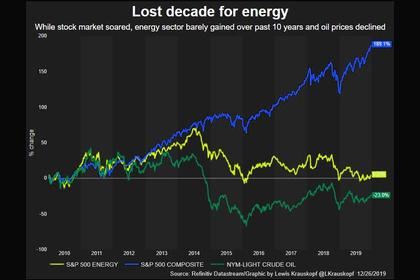
U.S. ENERGY LOST
“It really is a great irony that at a time when the United States became the world’s biggest producer and has become a great exporter, that investors have become skeptical and have adopted a position of ‘show me the money,’”
2019, December, 20, 10:00:00
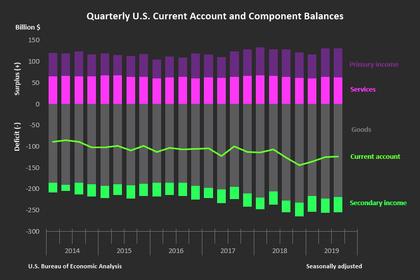
U.S. CURRENT ACCOUNT DEFICIT $124.1 BLN
The U.S. current account deficit, which reflects the combined balances on trade in goods and services and income flows between U.S. residents and residents of other countries, narrowed by $1.1 billion, or 0.9 percent, to $124.1 billion in the third quarter of 2019
2019, December, 18, 13:15:00
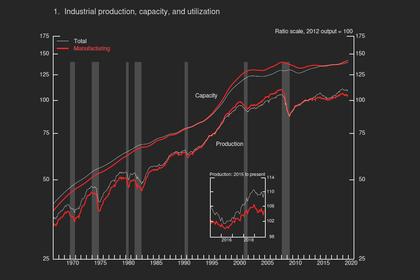
U.S. INDUSTRIAL PRODUCTION UP 1.1%
U.S. industrial production and manufacturing production both rebounded 1.1 percent in November after declining in October
2019, December, 13, 09:55:00
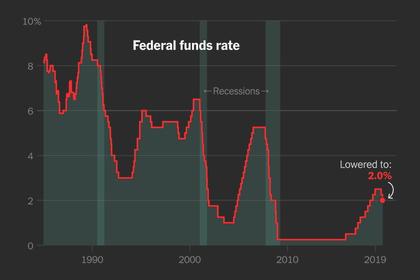
U.S. FEDERAL FUNDS RATE 1.5- 1.75%
Consistent with its statutory mandate, the Committee seeks to foster maximum employment and price stability. The Committee decided to maintain the target range for the federal funds rate at 1‑1/2 to 1-3/4 percent.


