2020-01-31 12:25:00


U.S. OIL PRODUCTION FORECAST: 14 MBD
U.S. EIA - Annual Energy Outlook 2020 with projections to 2050
Key Takeaways from U.S. Energy Information Administration's Annual Energy Outlook 2020
• In the U.S. Energy Information Administration’s (EIA) Annual Energy Outlook 2020 (AEO2020) Reference case, U.S. energy consumption
grows more slowly than gross domestic product throughout the projection period (2050) as U.S. energy efficiency continues to increase. This decline in the energy intensity of the U.S. economy continues through 2050.
• The electricity generation mix continues to experience a rapid rate of change, with renewables the fastest-growing source of electricity generation through 2050 because of continuing declines in the capital costs for solar and wind that are supported by federal tax credits and higher state-level renewables targets. With slow load growth and increasing electricity production from renewables, U.S. coal-fired and nuclear electricity generation declines; most of the decline occurs by the mid-2020s.
• The United States continues to produce historically high levels of crude oil and natural gas. Slow growth in domestic consumption of these fuels leads to increasing exports of crude oil, petroleum products, and liquefied natural gas.
• After falling during the first half of the projection period, total U.S. energy-related carbon dioxide emissions resume modest growth in the 2030s, driven largely by increases in energy demand in the transportation and industrial sectors; however, by 2050, they remain 4% lower than 2019 levels.
the United States continues to import and export energy throughout the projection period
• The United States imported more energy than it exported annually since 1953, but continued growth in petroleum and natural gas exports results in the United States becoming a net energy exporter in 2020 in all AEO2020 cases.
• In the AEO2020 Reference case, the United States exports more petroleum and other liquids than it imports annually starting in 2020 as U.S.
crude oil production continues to increase and domestic consumption of petroleum products decreases. Near the end of the projection period, the United States returns to importing more petroleum and other liquids than it exports on an energy basis as a result of increasing domestic gasoline consumption and falling domestic crude oil production after 2047.
• The United States became a net natural gas exporter on an annual basis in 2017 and continued to export more natural gas than it imported in 2018 and in 2019. In the AEO2020 Reference case, liquefied natural gas (LNG) exports to more distant destinations will increasingly dominate the U.S. natural gas trade, and the United States is projected to remain a net natural gas exporter through 2050.
• The United States continues to be a net exporter of coal (including coal coke) through 2050
global conditions are more important for oil prices and assumptions about resource and technology are more important for natural gas prices
• EIA’s assumed crude oil prices in AEO2020 are influenced more by assessments of international markets than by assumptions about domestic resources and technological advances. In the High Oil Price case, EIA projects the price of Brent crude oil in 2019 dollars to reach $183 per barrel (b) by 2050 compared with $105/b in the Reference case and $46/b in the Low Oil Price case.
• Natural gas prices are highly sensitive to factors that drive supply, such as domestic resource and technology assumptions, and are less dependent on the international conditions that drive oil prices. In the High Oil and Gas Supply case, Henry Hub natural gas prices remain lower than $3 per million British thermal units ($/MMBtu) throughout the projection period, but in the Low Oil and Gas Supply case, they rise to more than $6/MMBtu during the same period.
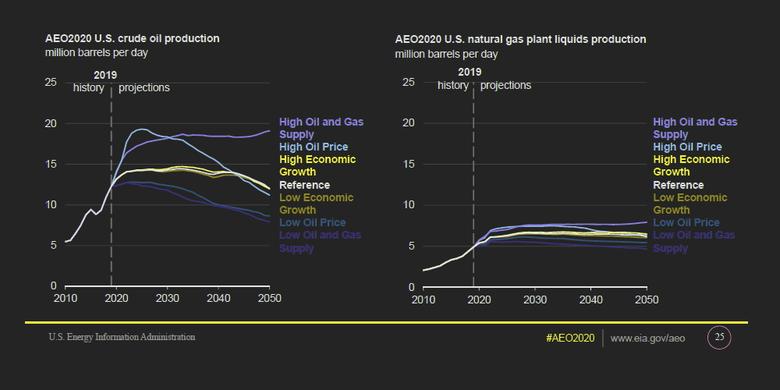
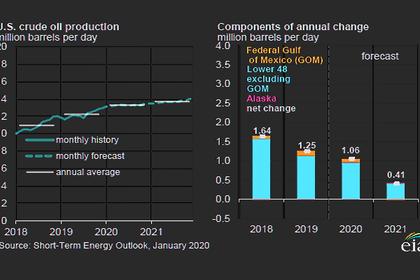
Production of U.S. crude oil and natural gas plant liquids continues to grow through 2025
• In the AEO2020 Reference case, U.S. crude oil production reaches 14.0 million barrels per day (b/d) by 2022 and remains near this level through 2045 as tight oil development moves into less productive areas and well productivity declines.
• The continued development of tight oil and shale gas resources in the AEO2020 Reference case supports growth in natural gas plant liquids (NGPL) production, which reaches 6.6 million b/d by 2028. NGPLs are light hydrocarbons predominantly found in natural gas wells and are diverted from the natural gas stream by natural gas processing plants. These hydrocarbons include ethane, propane, normal butane, isobutane, and natural gasoline.
• In the AEO2020 Reference case, NGPL production grows by 26% during the projection period as a result of demand increases by the global petrochemical industry. Most NGPL production growth in the AEO2020 Reference case occurs before 2025 as producers focus on natural gas plant liquids-rich plays, where NGPL-to-gas ratios are highest and increased demand spurs greater ethane recovery.
• In the AEO2020 cases, NGPL production is sensitive to changes in resource and technology assumptions, as well as oil price assumptions. In the High Oil and Gas Supply case, which has faster rates of technological improvement, higher recovery estimates, and additional tight oil and shale gas resources, NGPL production grows by 61% during the projection period. In the High Oil Price case, high crude oil prices lead to more drilling in the near term, but cost increases and fewer easily accessible resources decrease production of crude oil and NGPLs later in the forecast period.
U.S. dry natural gas production and consumption increase and natural gas production growth outpaces consumption
• Natural gas dry production in the AEO2020 Reference case grows 1.9% per year from 2020 to 2025, which is considerably slower than the 5.1%-per-year average growth rate from 2015 to 2020.
• U.S. natural gas consumption in the Reference case slows after 2020 and remains relatively flat through 2030 because of slower industrial sector growth. Consumption also declines in the electric power sector during this period. After 2030, consumption growth rises almost 1% per year on average as natural gas use in the electric power and industrial sectors increases.
• U.S. natural gas production grows at a faster rate than consumption in most cases after 2020, leading to an increase in U.S. exports of natural gas. The exception is in the AEO2020 Low Oil and Gas Supply case, where production and consumption remain relatively flat as a result of higher production costs.
The United States continues to export more natural gas than it imports because near-term growth in liquefied natural gas export capacity delivers domestic production to global markets
• In the AEO2020 Reference case, pipeline exports to Mexico and liquefied natural gas (LNG) exports to world markets increase moderately until 2025, after which pipeline export growth to Mexico slows. LNG exports continue to rise through 2030 before remaining relatively flat for the remainder of the projection period.
• Increasing natural gas exports to Mexico are a result of more pipeline infrastructure to and within Mexico, allowing for increased natural gasfired power generation. By 2030, Mexico’s domestic natural gas production begins to displace U.S. exports.
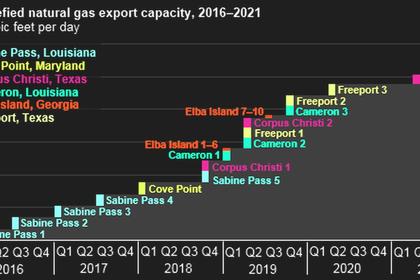
• Three more LNG-export facilities became operational in the Lower 48 states in 2019, bringing the total number to six. Two new LNG projects reached final investment decisions and started construction in 2019. All LNG-export facilities and expansions currently under construction are expected to be completed by 2025. U.S. LNG-export capacity will continue to serve growing global LNG demand, particularly in emerging Asian markets as long as U.S. natural gas prices remain competitive. As U.S.-sourced LNG becomes less competitive in world markets after 2030, export volumes level off.
• U.S. imports of natural gas from Canada, primarily from its prolific western region, continue to generally decline from historical levels. U.S. exports of natural gas to eastern Canada continue to increase because of eastern Canada’s proximity to U.S. natural gas resources in the Marcellus and Utica plays and new pipeline infrastructure. However, this export growth slows in the mid-2020s as Canada’s demand for natural gas begins to decline, particularly in the electric power sector, as Canada begins transitioning to more renewables in its generation mix.
-----
Earlier:
2020, January, 24, 13:35:00
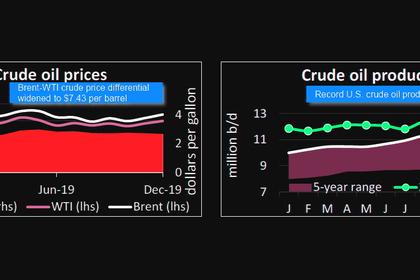
U.S. OIL EXPORTS 9 MBD
U.S. petroleum exports hit a new all-time high of 9.0 million barrels per day (mb/d) in the final month of 2019
2020, January, 24, 13:20:00
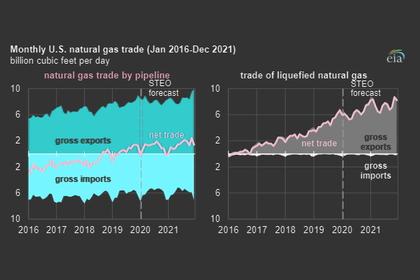
U.S. GAS EXPORTS UP TWICE
The U.S. Energy Information Administration (EIA) forecasts that U.S. natural gas exports will exceed natural gas imports by an average 7.3 billion cubic feet per day (Bcf/d) in 2020 (2.0 Bcf/d higher than in 2019) and 8.9 Bcf/d in 2021. Growth in U.S. net exports is led primarily by increases in liquefied natural gas (LNG) exports and pipeline exports to Mexico. Net natural gas exports more than doubled in 2019, compared with 2018, and EIA expects that they will almost double again by 2021 from 2019 levels.
2020, January, 22, 12:40:00
U.S. LNG PRODUCTION UP TO 9 BCFD
Total US LNG feedgas volumes reached a new all-time high of 9.4 Bcf/d Tuesday, after exceeding 9 Bcf/d for the first time on January 19.
2020, January, 15, 12:45:00
U.S. OIL SLOWDOWN
But Papa, boss of the world’s largest oilfield services company, expects U.S. output to grow by just 400,000 bpd in 2020 and by 100,000-500,000 bpd per year through 2025, depending on future oil prices.


