2020-01-24 13:25:00


U.S. OIL PRODUCTION SLOWING
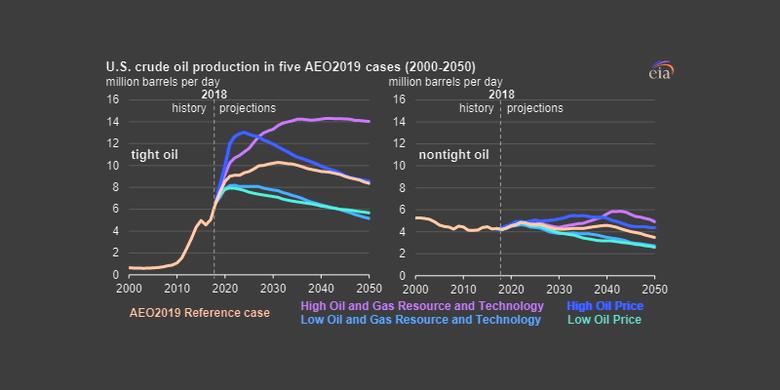
U.S. EIA - In the January 2020 update of its Short-Term Energy Outlook (STEO), the U.S. Energy Information Administration (EIA) forecasts that U.S. crude oil production will average 13.3 million barrels per day (b/d) in 2020, a 9% increase from 2019 production levels, and 13.7 million b/d in 2021, a 3% increase from 2020. Slowing crude oil production growth results from a decline in drilling rigs during the past year that EIA expects will continue through most of 2020. Despite the decline in rigs, EIA forecasts production will continue to grow as rig efficiency and well-level productivity rise, offsetting the decline in the number of rigs until drilling activity accelerates in 2021.

EIA’s U.S. crude oil production forecast is based on the West Texas Intermediate (WTI) price forecast in the January 2020 STEO, which rises from an average of $57 per barrel (b) in 2019 to an average of $59/b in 2020 and $62/b in 2021. The price forecast is highly uncertain, and any significant divergence of actual prices from the projected price path could change the pace of drilling and new well completion, which would in turn affect production.
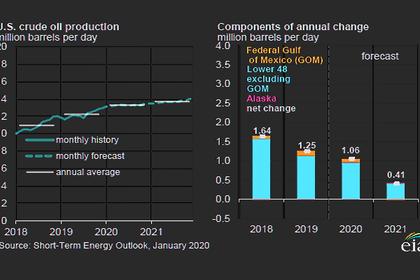
Crude oil production in the Lower 48 states has a relatively short investment and production cycle. Changes in Lower 48 crude oil production typically follow changes in crude oil prices and rig counts with about a four- to six-month lag. Because EIA forecasts WTI prices will decline during the first half of 2020 but begin increasing in the second half of the year and into 2021, forecast U.S. crude oil production grows slowly month over month until the end of 2020. In contrast, crude oil production in Alaska and the Federal Offshore Gulf of Mexico (GOM) is driven by long-term investment that is typically less sensitive to short-term price movements.
In 2019, Lower 48 production reached its largest annual average volume of 9.9 million b/d, and EIA expects it to increase further by an average of 1.0 million b/d in 2020 and 0.4 million b/d in 2021. EIA forecasts the GOM region will grow by 0.1 million b/d in 2020 to 2.0 million b/d and to remain relatively flat in 2021 because several projects expected to come online in 2021 will not start producing until late in the year and will be offset by declines from other producing fields. Alaska’s crude oil production will remain relatively unchanged at about 0.5 million b/d in 2020 and in 2021.
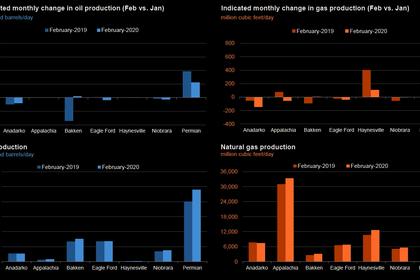
The Permian region remains the most prolific growth region in the United States. Favorable geology combined with technological improvements have contributed to the Permian region’s high returns on investment and years of remaining oil production growth potential. EIA forecasts that Permian production will average 5.2 million b/d in 2020, an increase of 0.8 million b/d from 2019 production levels. For 2021, the Permian will produce an average of 5.6 million b/d. EIA forecasts that the Bakken region in North Dakota will be the second-largest growth area in 2020 and 2021, growing by about 0.1 million b/d in each year (Figure 2).

EIA expects crude oil prices higher than $60/b in 2021 will contribute to rising crude oil production because producers will be able to fund drilling programs through cash flow and other funding sources, despite a somewhat more restrictive capital market. Financial statements of 46 publically-traded U.S. oil producers reveal that these companies generated sufficient cash from operating activities to fund investment and grow production with WTI prices in the $55/b–$60/b range. The 46 selected companies produced more than 30% of total U.S. liquids production in the third quarter of 2019. The four-quarter moving average free cash flow for these companies ranged between $1.7 billion and $3.5 billion from the fourth quarter of 2017 through the second quarter of 2019. The third quarter of 2019—the latest quarter for which data are available—had less cash from operations than investing activities, but this figure was skewed by the large, one-time acquisition cost of Anadarko Petroleum by Occidental, valued at $55 billion (Figure 3).

Results for these 46 publicly traded companies do not represent all U.S. oil producers because private companies that do not publish financial statements are not included in EIA’s analysis. The Federal Reserve Bank of Dallas Energy Survey sheds some light on the financial position of a broader set of companies. Released quarterly, the bank’s survey asks oil companies about business activity and employment and asks a few special questions that change each quarter. The number of companies that participate varies each quarter, but generally the survey includes about 100 exploration and production companies. In the most recent survey (from the fourth quarter of 2019), 75% of survey respondents said they can cover their capital expenditures through cash flow from operations at a WTI price of less than $60/b. In addition, 40% of survey respondents plan to increase capital expenditures in 2020 compared with 2019, while 24% of respondents expect to spend about the same (Figure 4).

Since about 2017, large, globally integrated oil companies have acquired more acreage in Lower 48 regions, particularly in the Permian. These companies have announced investment plans to make Lower 48 production an increasing portion of their portfolios. These companies can typically fund their investment programs through cash flow from operations and are generally less susceptible to tighter capital markets than smaller oil companies. The financial results of the public companies shown in Figure 3 and the Federal Reserve survey support EIA’s production forecast and suggest that U.S. crude oil production can continue to grow under EIA’s price forecast for 2020 and 2021 because many companies are less dependent on debt or equity to fund investment.
U.S. average regular gasoline and diesel prices decline
The U.S. average regular gasoline retail price fell more than 3 cents from the previous week to $2.54 per gallon on January 20, 29 cents higher than the same time last year. The Midwest price fell over 5 cents to $2.39 per gallon, the Gulf Coast price fell nearly 5 cents to $2.23 per gallon, the Rocky Mountain price fell more than 3 cents to $2.57 per gallon, the East Coast price fell more than 2 cents to $2.50 per gallon, and the West Coast price fell nearly 2 cents to $3.18 per gallon.
The U.S. average diesel fuel price fell nearly 3 cents from the previous week to $3.04 per gallon on January 20, 7 cents higher than a year ago. The Rocky Mountain price fell nearly 6 cents to $3.01 per gallon, the East Coast price fell nearly 4 cents to $3.08 per gallon, the Midwest price declined almost 3 cents to $2.94 per gallon, the West Coast price fell nearly 2 cents to $3.57 per gallon, and the Gulf Coast price dropped more than 1 cent to $2.80 per gallon.
Propane/propylene inventories decline
U.S. propane/propylene stocks decreased by 1.4 million barrels last week to 86.5 million barrels as of January 17, 2020, 17.1 million barrels (24.6%) greater than the five-year (2015-19) average inventory levels for this same time of year. Midwest, East Coast, Gulf Coast, and Rocky Mountain/West Coast inventories decreased by 0.7 million barrels, 0.4 million barrels, 0.2 million barrels, and 0.1 million barrels, respectively. Propylene non-fuel-use inventories represented 6.9% of total propane/propylene inventories.
Residential heating fuel prices decrease
As of January 20, 2020, residential heating oil prices averaged nearly $3.07 per gallon, 3 cents per gallon below last week’s price and 10 cents per gallon lower than last year’s price at this time. Wholesale heating oil prices averaged almost $1.96 per gallon, more than 7 cents per gallon below last week’s price and more than 7 cents per gallon lower than a year ago.
Residential propane prices averaged almost $2.01 per gallon, less than 1 cent per gallon below last week’s price and more than 42 cents per gallon less than a year ago. Wholesale propane prices averaged more than $0.60 per gallon, nearly 4 cents per gallon lower than last week’s price and 20 cents per gallon below last year’s price.
-----
Earlier:
2020, January, 22, 12:50:00
U.S. PRODUCTION: OIL + 22 TBD, GAS + 65 MCFD
Crude oil production from the major US onshore regions is forecast to increase 49,000 b/d month-over-month in November from 9,084 to 9,133 thousand barrels/day, gas production to increase 263 million cubic feet/day from 84,930 to 85,193 million cubic feet/day .

2020, January, 20, 11:30:00
U.S. RIGS UP 15 TO 796
U.S. Rig Count is up 15 rigs from last week to 796, Canada Rig Count is up 41 rigs from last week to 244
2020, January, 17, 11:00:00
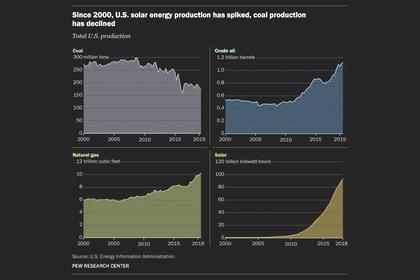
U.S. RENEWABLES UP
Solar and wind power use has grown at a rapid rate over the past decade or so, but as of 2018 those sources accounted for less than 4% of all the energy used in the U.S.
2020, January, 15, 12:45:00
U.S. OIL SLOWDOWN
But Papa, boss of the world’s largest oilfield services company, expects U.S. output to grow by just 400,000 bpd in 2020 and by 100,000-500,000 bpd per year through 2025, depending on future oil prices.


