2020-01-31 11:45:00


U.S. RENEWABLES WILL UP
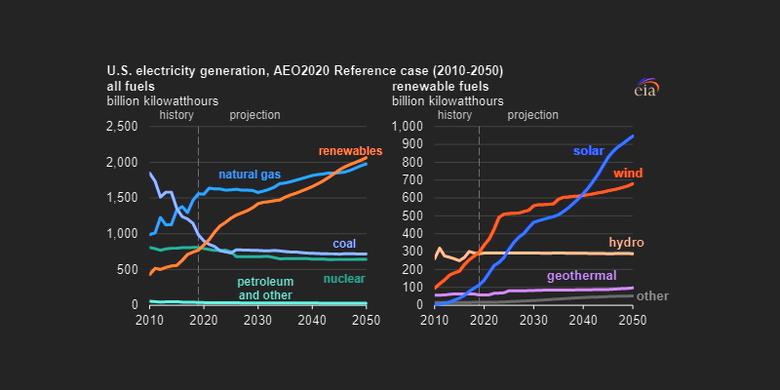
U.S. EIA - In the latest long-term projections, the U.S Energy Information Administration (EIA) projects electricity generation from renewable sources such as wind and solar to surpass nuclear and coal by 2021 and to surpass natural gas in 2045. In the Annual Energy Outlook 2020 (AEO2020) Reference case, the share of renewables in the U.S. electricity generation mix increases from 19% in 2019 to 38% in 2050.
Most of the growth in renewable electricity generation is attributed to wind and solar, which account for about half of renewable generation today. In EIA's AEO2020 Reference case, these technologies account for nearly 80% of the renewable total in 2050. New wind capacity additions continue at much lower levels after production tax credits expire in the early 2020s.
In AEO2020, growth in solar photovoltaic (PV) capacity continues through 2050 for both utility-scale and small-scale applications because of declining PV costs throughout the projection period. Conventional hydroelectric generation remains relatively unchanged in absolute terms and becomes a smaller portion of the generation mix as other sources of electricity generation increase.

Alternative scenarios in AEO2020 examine the sensitivity of results to changes in the costs of renewables and the availability of oil and natural gas resources. Even in the High Oil and Gas Supply (where natural gas prices remain lower than in the Reference case) and High Renewables Cost cases, renewable generation nearly doubles from current levels by 2050.
The High and Low Renewables Cost cases evaluate the effects of changing cost assumptions for constructing and operating renewable energy power plants. In all AEO2020 scenarios, experience-based factors (such as learning-by-doing) contribute to lower capital costs over time.
For the Low Renewables Cost case, EIA assumed learning rates for renewable technologies that result in overnight capital costs that, by 2050, are 40% lower than the Reference case assumptions for each renewable technology (including those in the end-use sectors, such as small-scale solar PV). For the High Renewables Cost case, EIA assumed the overnight capital cost for all renewable technologies are held constant at the 2019 level through 2050.

Renewable generation grows in all regions of the United States in all AEO2020 scenarios, but the preferred technology type depends on the availability of renewable energy resources. Wind-powered generation grows the most in the West and Mid-Continent regions, and solar-powered generation grows the most in the Southeast. Offshore wind is only built off the coast of the Northeast and the PJM Interconnection.

-----
Earlier:
2020, January, 29, 13:00:00
U.S. RENEWABLES CONSUMPTION 12%
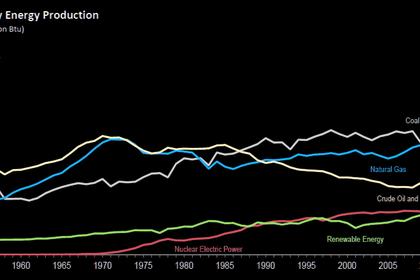
U.S. renewable energy consumption totaled 924 trillion British thermal units (Btu), which accounted for 12% of U.S. total primary energy consumption.
2020, January, 24, 13:30:00
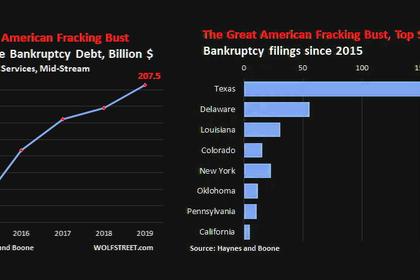
U.S., CANADA BANKRUPTCIES UP 50%
U.S. and Canadian oil and natural gas exploration and production company bankruptcies totaled 42 in 2019, up from 28 in 2018,
2020, January, 24, 13:20:00
U.S. GAS EXPORTS UP TWICE
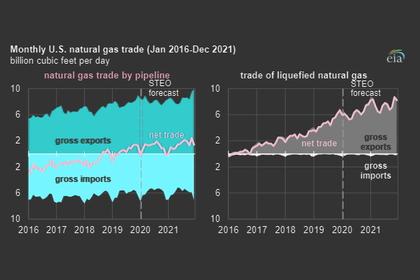
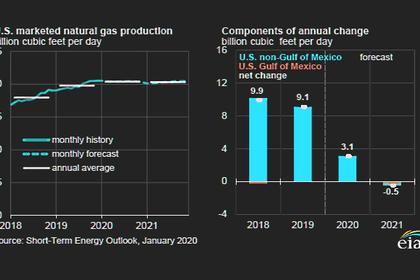
The U.S. Energy Information Administration (EIA) forecasts that U.S. natural gas exports will exceed natural gas imports by an average 7.3 billion cubic feet per day (Bcf/d) in 2020 (2.0 Bcf/d higher than in 2019) and 8.9 Bcf/d in 2021. Growth in U.S. net exports is led primarily by increases in liquefied natural gas (LNG) exports and pipeline exports to Mexico. Net natural gas exports more than doubled in 2019, compared with 2018, and EIA expects that they will almost double again by 2021 from 2019 levels.
2020, January, 22, 12:40:00
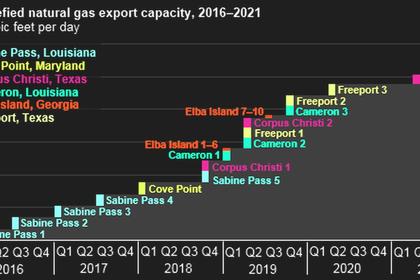
U.S. LNG PRODUCTION UP TO 9 BCFD
Total US LNG feedgas volumes reached a new all-time high of 9.4 Bcf/d Tuesday, after exceeding 9 Bcf/d for the first time on January 19.
2020, January, 17, 11:00:00
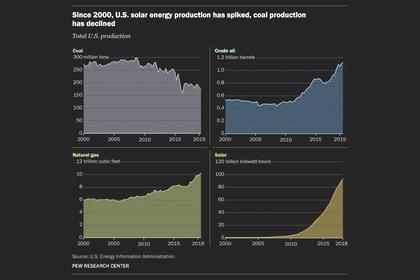
U.S. RENEWABLES UP
Solar and wind power use has grown at a rapid rate over the past decade or so, but as of 2018 those sources accounted for less than 4% of all the energy used in the U.S.
2020, January, 15, 12:40:00
U.S. GAS WILL DOWN
U.S. dry gas production will fall to 94.11 billion cubic feet per day (bcfd) in 2021 from a record 94.74 bcfd in 2020. The current all-time high is 92.03 bcfd in 2019.


