2020-10-07 10:25:00


U.S. INTERNATIONAL TRADE DEFICIT $67.1 BLN
U.S. BEA - October 6, 2020 - U.S. International Trade in Goods and Services, August 2020
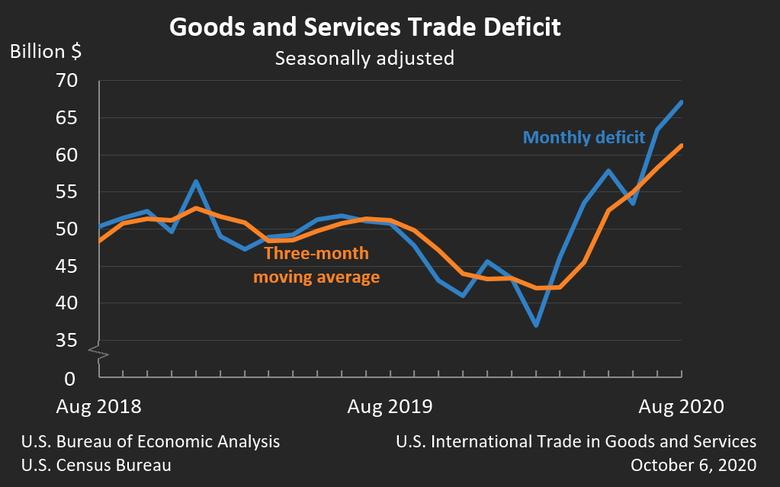
The U.S. Census Bureau and the U.S. Bureau of Economic Analysis announced today that the goods and services deficit was $67.1 billion in August, up $3.7 billion from $63.4 billion in July, revised.
| Deficit: | $67.1 Billion | +5.9%° |
| Exports: | $171.9 Billion | +2.2%° |
| Imports: | $239.0 Billion | +3.2%° |
|
Next release: November 4, 2020 (°) Statistical significance is not applicable or not measurable. Data adjusted for seasonality but not price changes Source: U.S. Census Bureau, U.S. Bureau of Economic Analysis; U.S. International Trade in Goods and Services, October 6, 2020 |
||
Exports, Imports, and Balance (exhibit 1)
August exports were $171.9 billion, $3.6 billion more than July exports. August imports were $239.0 billion, $7.4 billion more than July imports.
The August increase in the goods and services deficit reflected an increase in the goods deficit of $3.0 billion to $83.9 billion and a decrease in the services surplus of $0.7 billion to $16.8 billion.
Year-to-date, the goods and services deficit increased $22.6 billion, or 5.7 percent, from the same period in 2019. Exports decreased $296.1 billion or 17.6 percent. Imports decreased $273.5 billion or 13.1 percent.
Three-Month Moving Averages (exhibit 2)
The average goods and services deficit increased $3.1 billion to $61.3 billion for the three months ending in August.
- Average exports increased $10.0 billion to $165.2 billion in August.
- Average imports increased $13.1 billion to $226.6 billion in August.
Year-over-year, the average goods and services deficit increased $10.1 billion from the three months ending in August 2019.
- Average exports decreased $44.8 billion from August 2019.
- Average imports decreased $34.7 billion from August 2019.
Exports (exhibits 3, 6, and 7)
Exports of goods increased $3.5 billion to $119.1 billion in August.
Exports of goods on a Census basis increased $3.4 billion.
- Industrial supplies and materials increased $3.9 billion.
- Nonmonetary gold increased $1.8 billion.
- Foods, feeds, and beverages increased $1.1 billion.
- Soybeans increased $1.0 billion.
- Capital goods decreased $1.4 billion.
- Semiconductors decreased $1.2 billion.
Net balance of payments adjustments increased $0.1 billion.
Exports of services increased $0.1 billion to $52.8 billion in August.
- Other business services increased $0.2 billion.
- Transport increased $0.1 billion.
- Charges for the use of intellectual property increased $0.1 billion.
- Travel decreased $0.2 billion.
Imports (exhibits 4, 6, and 8)
Imports of goods increased $6.5 billion to $203.0 billion in August.
Imports of goods on a Census basis increased $6.5 billion.
- Consumer goods increased $3.8 billion.
- Pharmaceutical preparations increased $2.7 billion.
- Automotive vehicles, parts, and engines increased $1.7 billion.Other goods increased $1.1 billion.
- Passenger cars increased $1.0 billion.
- Industrial supplies and materials decreased $1.5 billion.
- Nonmonetary gold decreased $2.1 billion.
- Finished metal shapes decreased $1.6 billion.
- Crude oil increased $1.0 billion.
Net balance of payments adjustments increased less than $0.1 billion.
Imports of services increased $0.8 billion to $36.1 billion in August.
- Travel increased $0.3 billion.
- Transport increased $0.3 billion.
Real Goods in 2012 Dollars – Census Basis (exhibit 11)
The real goods deficit increased $1.2 billion to $92.3 billion in August.
- Real exports of goods increased $3.5 billion to $136.7 billion.
- Real imports of goods increased $4.7 billion to $229.0 billion.
Revisions
Revisions to July exports
- Exports of goods were revised up $0.2 billion.
- Exports of services were revised up less than $0.1 billion.
Revisions to July imports
- Imports of goods were revised up $0.1 billion.
- Imports of services were revised down less than $0.1 billion.
Goods by Selected Countries and Areas: Monthly – Census Basis (exhibit 19)
The August figures show surpluses, in billions of dollars, with South and Central America ($2.4), Hong Kong ($1.7), OPEC ($1.3), Brazil ($1.0), United Kingdom ($1.0), Saudi Arabia ($0.2), and Singapore ($0.1). Deficits were recorded, in billions of dollars, with China ($26.4), European Union ($15.7), Mexico ($12.5), Germany ($4.6), Japan ($4.3), Italy ($2.6), Taiwan ($2.6), India ($2.3), France ($2.2), South Korea ($2.2), and Canada ($1.2).
- The deficit with Germany increased $1.6 billion to $4.6 billion in August. Exports decreased $0.3 billion to $4.9 billion and imports increased $1.2 billion to $9.6 billion.
- The deficit with Japan increased $1.0 billion to $4.3 billion in August. Exports increased $0.6 billion to $5.3 billion and imports increased $1.5 billion to $9.6 billion.
- The deficit with China decreased $1.9 billion to $26.4 billion in August. Exports increased $1.7 billion to $11.2 billion and imports decreased $0.2 billion to $37.7 billion.
-----
Earlier:
2020, October, 5, 13:20:00
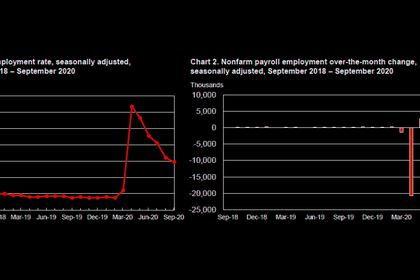
U.S. UNEMPLOYMENT DOWN TO 7.9%
Total U.S. nonfarm payroll employment rose by 661,000 in September, and the unemployment rate declined to 7.9 percent,
2020, October, 1, 13:20:00
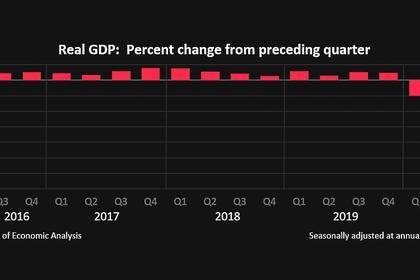
U.S. GDP DOWN 31.4%
U.S. real gross domestic product (GDP) decreased at an annual rate of 31.4 percent in the second quarter of 2020
2020, September, 22, 13:15:00
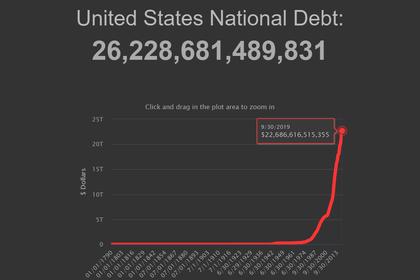
U.S. DEBT WILL TWICE
Without changes to tax and spending laws, the U.S. federal debt held by the public will reach 195% of GDP by 2050,
2020, September, 21, 11:55:00
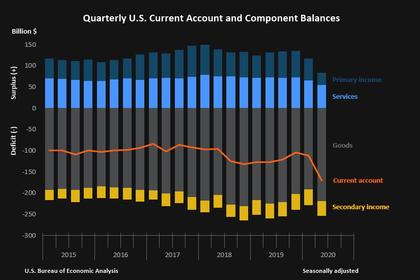
U.S. CARRENT ACCOUNT DEFICIT $170.5 BLN
The U.S. current account deficit, which reflects the combined balances on trade in goods and services and income flows between U.S. residents and residents of other countries, widened by $59.0 billion, or 52.9 percent, to $170.5 billion in the second quarter of 2020
2020, September, 17, 16:45:00
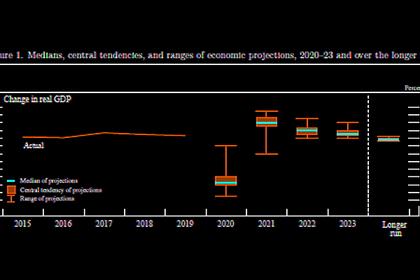
U.S. GDP WILL DOWN 3.7%
Federal Reserve Board and Federal Open Market Committee release economic projections from the September 15-16 FOMC meeting
2020, September, 17, 16:40:00
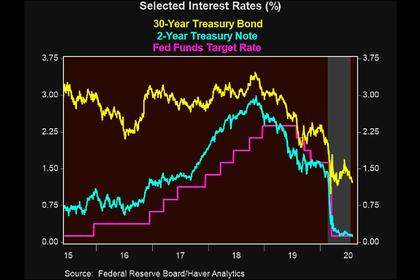
U.S. FEDERAL FUNDS RATE 0.0 - 0.25%
The Committee decided to keep the target range for the federal funds rate at 0 to 1/4 percent
2020, September, 16, 11:25:00
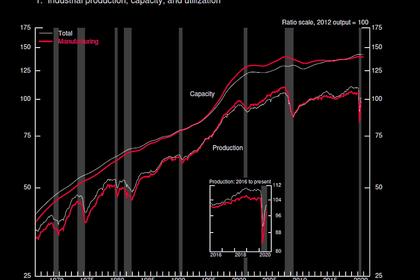
U.S. INDUSTRIAL PRODUCTION UP
U.S. industrial production rose 0.4 percent in August for its fourth consecutive monthly increase.


