2020-10-08 12:50:00


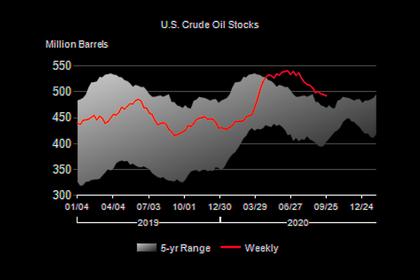
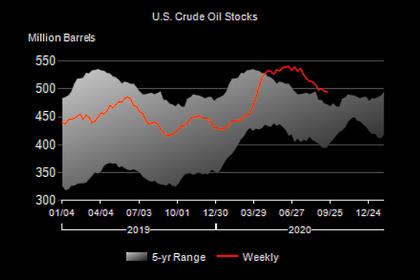
U.S. OIL INVENTORIES UP BY 0.5 MB TO 492.9 MB
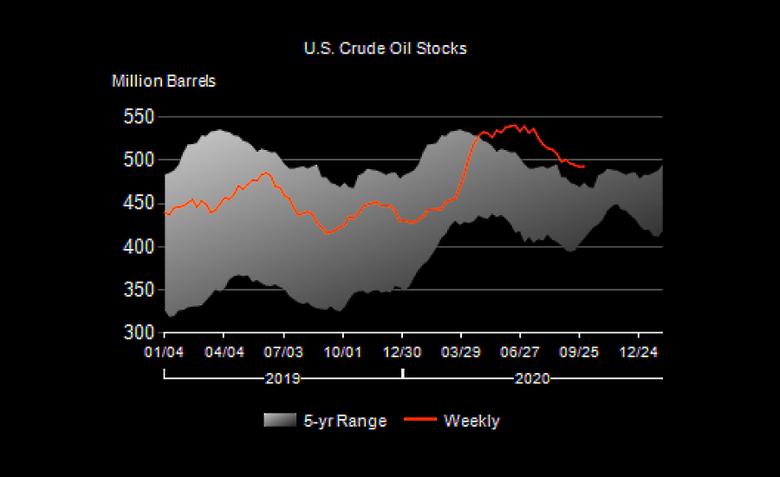
U.S. EIA - Oct. 7, 2020 - Data for week ending Oct. 2, 2020
Summary of Weekly Petroleum Status Report
U.S. crude oil refinery inputs averaged 13.9 million barrels per day during the week ending October 2, 2020 which was 184,000 barrels per day more than the previous week's average. Refineries operated at 77.1% of their operable capacity last week. Gasoline production increased last week, averaging 9.5 million barrels per day. Distillate fuel production increased last week, averaging 4.5 million barrels per day.
U.S. crude oil imports averaged 5.7 million barrels per day last week, increased by 0.6 million barrels per day from the previous week. Over the past four weeks, crude oil imports averaged about 5.3 million barrels per day, 18.9% less than the same four-week period last year. Total motor gasoline imports (including both finished gasoline and gasoline blending components) last week averaged 849,000 barrels per day, and distillate fuel imports averaged 230,000 barrels per day.
U.S. commercial crude oil inventories (excluding those in the Strategic Petroleum Reserve) increased by 0.5 million barrels from the previous week. At 492.9 million barrels, U.S. crude oil inventories are about 12% above the five year average for this time of year. Total motor gasoline inventories decreased by 1.4 million barrels last week and are about 0% below the five year average for this time of year. Finished gasoline and blending components inventories both decreased last week. Distillate fuel inventories decreased by 1.0 million barrels last week and are about 23% above the five year average for this time of year. Propane/propylene inventories decreased by 0.1 million barrels last week and are about 14% above the five year average for this time of year. Total commercial petroleum inventories decreased by 2.0 million barrels last week.
Total products supplied over the last four-week period averaged 17.8 million barrels a day, down by 14.8% from the same period last year.
Over the past four weeks, motor gasoline product supplied averaged 8.6 million barrels a day, down by 6.7% from the same period last year. Distillate fuel product supplied averaged 3.6 million barrels a day over the past four weeks, down by 9.3% from the same period last year. Jet fuel product supplied was down 47.5% compared with the same fourweek period last year.
The West Texas Intermediate crude oil price was $36.90 per barrel on October 2, 2020, $3.16 below last week's price and $15.94 less than a year ago. The spot price for conventional gasoline in the New York Harbor was $1.187 per gallon, $0.069 less than last week's price and $0.486 below a year ago. The spot price for No. 2 heating oil in the New York Harbor was $1.043 per gallon, $0.022 below last week's price and $0.837 under a year ago.
The national average retail regular gasoline price was $2.172 per gallon on October 5, 2020, $0.003 per gallon higher than last week's price but $0.473 under a year ago. The national average retail diesel fuel price was $2.387 per gallon, $0.007 per gallon below last week's level and $0.660 under a year ago.
-----
Earlier:

2020, October, 5, 12:45:00
U.S. RIGS UP 5 TO 266
U.S. Rig Count is up 5 from last week to 266, Canada Rig Count is up 4 from last week to 75
2020, October, 1, 13:35:00
U.S. OIL INVENTORIES DOWN BY 2.0 MB TO 492.4 MB
U.S. commercial crude oil inventories decreased by 2.0 million barrels to 492.4 million barrels
2020, September, 24, 12:15:00
U.S. OIL INVENTORIES DOWN BY 1.6 MB TO 494.4 MB
U.S. commercial crude oil inventories decreased by 1.6 million barrels to 494.4 million barrels,
2020, September, 23, 15:10:00
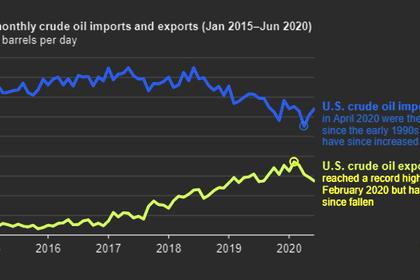
U.S. OIL EXPORTS UPDOWN
Despite a decline since the record monthly high of 3.7 million b/d in February, U.S. crude oil exports averaged 3.2 million b/d in the first half of 2020, up from 2.9 million b/d in the first half of 2019.
2020, September, 22, 13:10:00
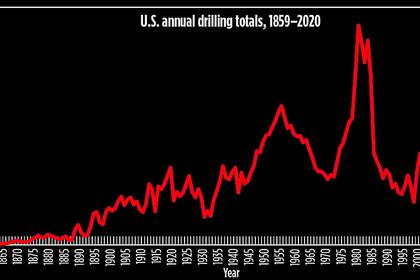
U.S. DRILLING: THE LOWEST
the U.S. total drilling for the year will definitely be the lowest since before 1940.
2020, September, 15, 16:30:00
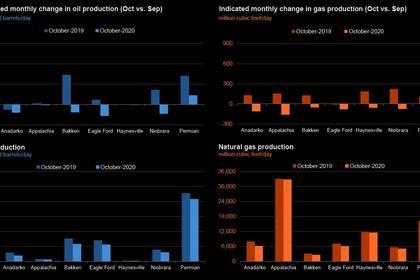
U.S. PRODUCTION: OIL (-68) TBD, GAS (-428) MCFD
Crude oil production from the major US onshore regions is forecast to decrease 68,000 b/d month-over-month in September from 7,708 to 7,640 thousand barrels/day, gas production to decrease 428 million cubic feet/day from 81,026 to 80,598 million cubic feet/day .
2020, September, 15, 16:25:00
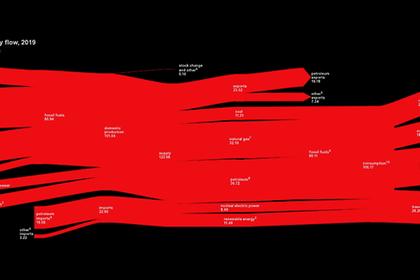
U.S. FOSSIL FUELS 80%
In 2019, 80% of U.S. domestic energy production was from fossil fuels, and 80% of domestic energy consumption originated from fossil fuels.


