2020-11-17 13:00:00


U.S. GAS INVENTORIES UP
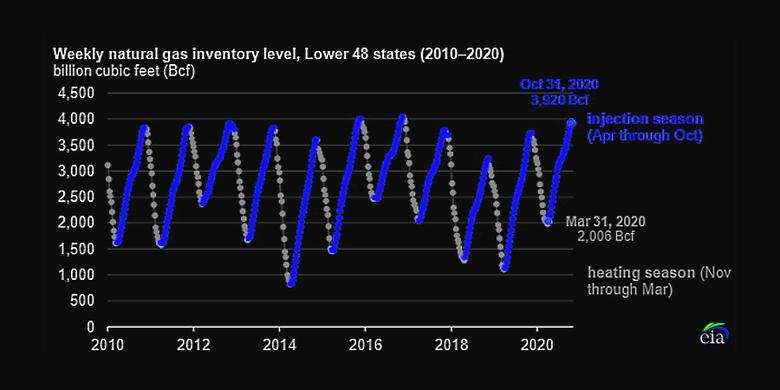
U.S. EIA - The amount of working natural gas in storage in the United States ended the natural gas injection, or refill, season (April 1–October 31) at 3,920 billion cubic feet (Bcf), according to interpolated data from the U.S. Energy Information Administration’s (EIA) Weekly Natural Gas Storage Report released on November 13. The amount of natural gas held in underground storage in the Lower 48 states is now near the record-high value, 4,047 Bcf, reached in mid-November 2016.
Working natural gas inventories were 2,006 Bcf on April 1, or 314 Bcf more than the average April 1 total in the previous five years. Higher inventory levels at the start of the injection season mean that storage operators can reach their end-of-season targets with smaller natural gas injections.
Net additions to working natural gas inventories totaled 1,914 Bcf during the injection season, about 2% less than the five-year average and 23% less than the near-record net injections of 2,571 Bcf reported during the 2019 injection season.
U.S. natural gas inventories climbed quickly in the spring and early summer. By the week of August 7, inventories exceeded the upper bound of the previous five-year range (the lowest to the highest levels) for that time of year. Since then, the pace of weekly injections has slowed because of slowing natural gas production throughout 2020 and relatively steady natural gas demand.
-----
Earlier:
2020, November, 13, 13:15:00
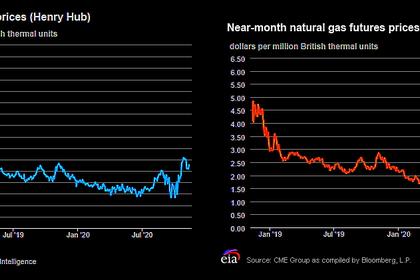
U.S. GAS PRICES UP TO $3
the natural gas spot price at the Henry Hub reached $3.00 per million British thermal units (MMBtu), its highest value since March 2019,
2020, November, 5, 12:05:00
U.S. LNG STOP $7 BLN
NextDecade is currently developing the 27 Mt/year LNG export project, which is facing opposition over environmental concerns.
2020, November, 3, 13:15:00
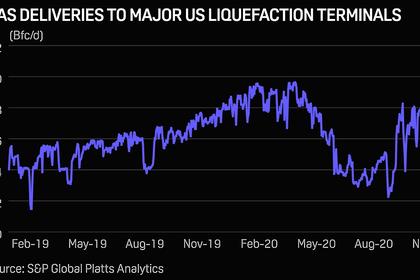
U.S. LNG DEMAND UP
Total US feedgas deliveries stood at 9.85 Bcf/d on Nov. 2, down from 10.02 Bcf/d the day before and 10.37 Bcf/d on Oct. 31
2020, November, 2, 17:15:00
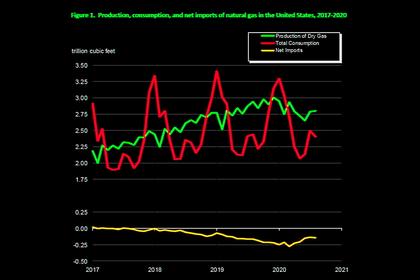
U.S. GAS PRODUCTION DOWN
The preliminary level for dry natural gas production in August 2020 was 2,801 billion cubic feet (Bcf), or 90.4 Bcf/d. This level was 4.5 Bcf/d (-4.7%) lower than the August 2019 level of 94.8 Bcf/d.
2020, October, 27, 14:30:00
U.S. LNG FOR INDIA
The US was the fifth-largest supplier of LNG to India in 2019, according to the Department of Energy.
2020, October, 19, 14:30:00
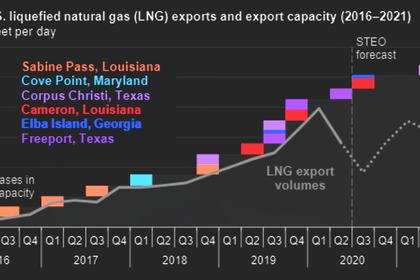
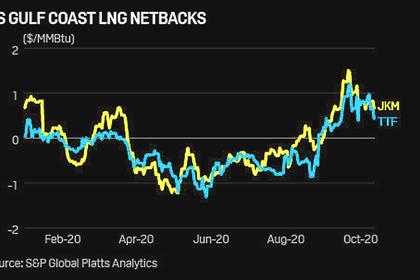
U.S. LNG EXPORTS UP
With positive spreads between the US Henry Hub price and end-user markets, the ramp-up in terminal utilization should gain steam in the near-term, in a bullish sign for overall demand for US LNG.


