2020-11-02 17:15:00


U.S. GAS PRODUCTION DOWN
U.S. EIA - October 30, 2020 - Data for August 2020 - Natural Gas Monthly August 2020
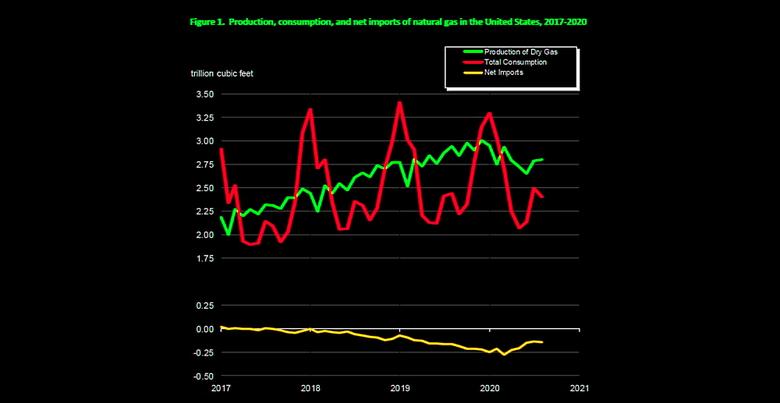
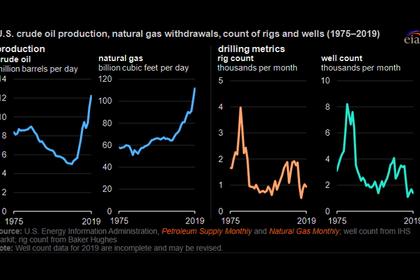
- In August 2020, for the fourth consecutive month, dry natural gas production decreased year over year for the month. The preliminary level for dry natural gas production in August 2020 was 2,801 billion cubic feet (Bcf), or 90.4 Bcf/d. This level was 4.5 Bcf/d (-4.7%) lower than the August 2019 level of 94.8 Bcf/d. Despite this year-over-year decrease, the average daily rate of dry production was the second highest for the month since the U.S. Energy Information Administration (EIA) began tracking monthly dry production in 1973.
- Estimated natural gas consumption in August 2020 was 2,407 Bcf, or 77.6 Bcf/d. This level was 1.1 Bcf/d (-1.4%) lower than the 78.7 Bcf/d consumed in August 2019. Despite this year-over-year decrease, the average daily rate of natural gas consumption for August 2020 was the second highest for the month since EIA began using the current definitions for consuming sectors in 2001.
- The year-over-year average daily rate of consumption of dry natural gas in August 2020 decreased in three of the four consuming sectors. Deliveries of natural gas by consuming sector in August 2020 were as follows:
- Residential deliveries: 110 Bcf for the month, or 3.5 Bcf/d• Up 7.8% compared with 3.3 Bcf/d in August 2019. Residential deliveries were the highest for the month since 2011.
- Commercial deliveries: 131 Bcf for the month, or 4.2 Bcf/d • Down 7.1% compared with 4.5 Bcf/d in August 2019. Commercial deliveries were the lowest for the month since 2010.
- Industrial deliveries: 654 Bcf for the month, or 21.1 Bcf/d • Down 2.7% compared with 21.7 Bcf/d in August 2019. Industrial deliveries were the lowest for the month since 2017.
- Electric power deliveries: 1,281 Bcf for the month, or 41.3 Bcf/d • Down 0.5% compared with 41.5 Bcf/d in August 2019. Electric power deliveries decreased year-over-year for the first time since May 2019. Despite this decrease, electric power deliveries were the second highest for the month since EIA began using the current definitions for consuming sectors in 2001.
- Net natural gas imports (imports minus exports) were -145 Bcf, or -4.7 Bcf/d, in August 2020, making the United States a net exporter. Natural gas imports and exports in August 2020 were as follows:
- Total imports: 214 Bcf for the month, or 6.9 Bcf/d
• Down 2.7% compared with 7.1 Bcf/d in August 2019. The average daily rate of natural gas imports was the lowest for the month since 2014. - Total exports: 359 Bcf for the month, or 11.6 Bcf/d
• Down 6.8% compared with 12.4 Bcf/d in August 2019, the third consecutive month with a year-over-year decrease after 67 consecutive months of year-over-year increases, from November 2014 to May 2020. Despite this year-over-year decrease, the average daily rate of natural gas exports was the second highest for the month since EIA began tracking monthly exports in 1973. Liquefied natural gas (LNG) exports in August 2020 were down 19.4% compared with August 2019, as global LNG demand remains depressed. In August 2020, the United States exported 3.6 Bcf/d of LNG to 20 countries.
- Total imports: 214 Bcf for the month, or 6.9 Bcf/d
-----
Earlier:
2020, October, 26, 14:00:00
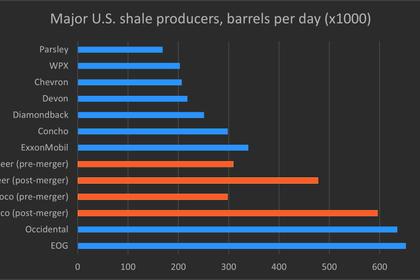
U.S. SHALE SURVIVORS
The sector is in full-on merger mode in response to oil prices that have been stuck at around $40 a barrel in recent months after the Covid-19 pandemic hit global demand.
2020, October, 19, 14:35:00
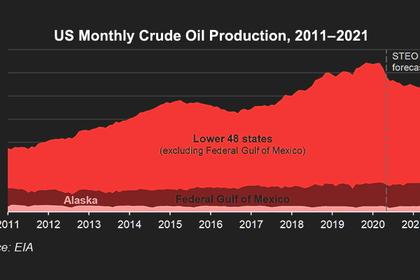
U.S. SHALE RECOVERY
US oil production is unlikely to return to a pre-pandemic peak of more than 13 million b/d,
2020, October, 19, 14:30:00
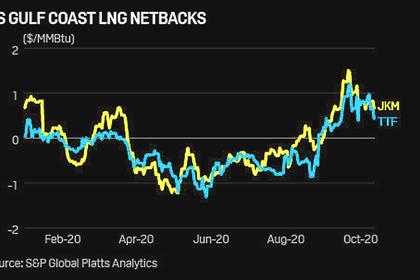
U.S. LNG EXPORTS UP
With positive spreads between the US Henry Hub price and end-user markets, the ramp-up in terminal utilization should gain steam in the near-term, in a bullish sign for overall demand for US LNG.
2020, October, 12, 11:40:00
U.S. SHALE EFFICIENCY
To achieve financial sustainability, companies need to focus on capital efficiency across the value chain.
2020, October, 6, 15:50:00
U.S. ENERGY UPDOWN
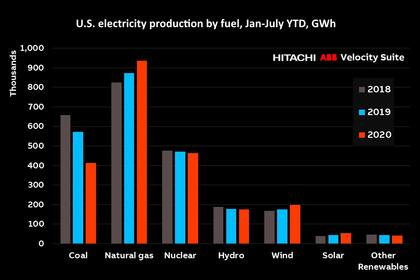
Driven by unprecedented low fuel prices, gas power production increased by 7.1% during the first seven months from last year, while coal dipped dramatically by 27.5%.


