2020-11-05 12:25:00


U.S. INTERNATIONAL TRADE DEFICIT DOWN
U.S. BEA - November 4, 2020 - U.S. International Trade in Goods and Services, September 2020
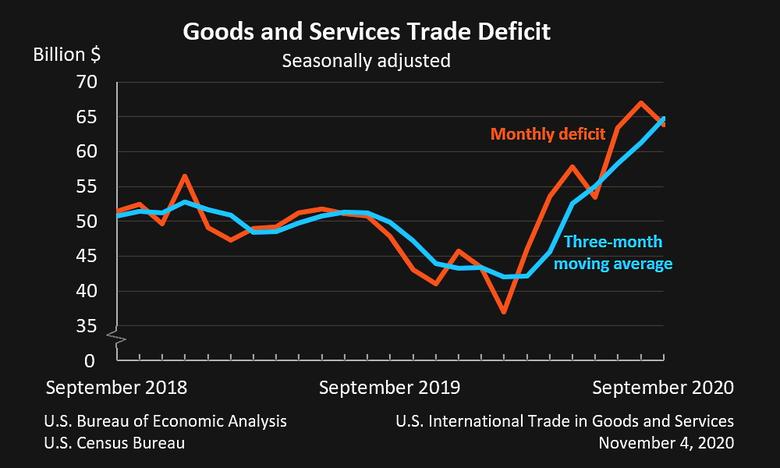
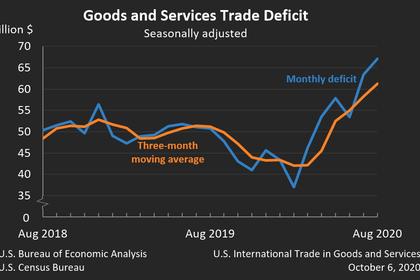
The U.S. Census Bureau and the U.S. Bureau of Economic Analysis announced today that the goods and services deficit was $63.9 billion in September, down $3.2 billion from $67.0 billion in August, revised.
| Deficit: | $63.9 Billion | -4.7% |
| Exports: | $176.4 Billion | +2.6%° |
| Imports: | $240.2 Billion | +0.5%° |
|
Next release: December 4, 2020 (°) Statistical significance is not applicable or not measurable. Data adjusted for seasonality but not price changes Source: U.S. Census Bureau, U.S. Bureau of Economic Analysis; U.S. International Trade in Goods and Services, November 4, 2020 |
||
Exports, Imports, and Balance (exhibit 1)
September exports were $176.4 billion, $4.4 billion more than August exports. September imports were $240.2 billion, $1.2 billion more than August imports.
The September decrease in the goods and services deficit reflected a decrease in the goods deficit of $3.1 billion to $80.7 billion and an increase in the services surplus of less than $0.1 billion to $16.8 billion.
Year-to-date, the goods and services deficit increased $38.5 billion, or 8.6 percent, from the same period in 2019. Exports decreased $329.0 billion or 17.4 percent. Imports decreased $290.4 billion or 12.4 percent.
Three-Month Moving Averages (exhibit 2)
The average goods and services deficit increased $3.5 billion to $64.8 billion for the three months ending in September.
- Average exports increased $7.0 billion to $172.2 billion in September.
- Average imports increased $10.4 billion to $237.0 billion in September.
Year-over-year, the average goods and services deficit increased $14.9 billion from the three months ending in September 2019.
- Average exports decreased $37.9 billion from September 2019.
- Average imports decreased $23.0 billion from September 2019.
Exports (exhibits 3, 6, and 7)
Exports of goods increased $3.7 billion to $122.8 billion in September.
Exports of goods on a Census basis increased $3.8 billion.
- Foods, feeds, and beverages increased $1.6 billion.
- Soybeans increased $1.4 billion.
- Capital goods increased $1.4 billion.
- Telecommunications equipment increased $0.4 billion.
- Industrial engines increased $0.3 billion.
- Computer accessories increased $0.2 billion.
Net balance of payments adjustments decreased $0.1 billion.
Exports of services increased $0.7 billion to $53.6 billion in September.
- Transport increased $0.2 billion.
- Travel increased $0.1 billion.
- Financial services increased $0.1 billion.
- Other business services increased $0.1 billion.
Imports (exhibits 4, 6, and 8)
Imports of goods increased $0.6 billion to $203.5 billion in September.
Imports of goods on a Census basis increased $0.1 billion.
- Automotive vehicles, parts, and engines increased $3.2 billion.Capital goods increased $0.8 billion.
- Passenger cars increased $2.4 billion.
- Consumer goods decreased $2.1 billion.
- Cell phones and other household goods decreased $2.3 billion.
- Industrial supplies and materials decreased $1.3 billion.
- Finished metal shapes decreased $1.4 billion.
Net balance of payments adjustments increased $0.5 billion.
Imports of services increased $0.6 billion to $36.8 billion in September.
- Travel increased $0.3 billion.
- Transport increased $0.2 billion.
Real Goods in 2012 Dollars – Census Basis (exhibit 11)
The real goods deficit decreased $4.8 billion to $87.6 billion in September.
- Real exports of goods increased $3.4 billion to $140.1 billion.
- Real imports of goods decreased $1.4 billion to $227.7 billion.
Revisions
Revisions to August exports
- Exports of goods were revised down less than $0.1 billion.
- Exports of services were revised up $0.1 billion.
Revisions to August imports
- Imports of goods were revised down $0.1 billion.
- Imports of services were revised up less than $0.1 billion.
Goods by Selected Countries and Areas: Monthly – Census Basis (exhibit 19)
The September figures show surpluses, in billions of dollars, with South and Central America ($2.5), OPEC ($1.4), Hong Kong ($1.3), Brazil ($1.1), United Kingdom ($0.8), Singapore ($0.3), and Saudi Arabia ($0.2). Deficits were recorded, in billions of dollars, with China ($24.3), European Union ($17.3), Mexico ($10.7), Japan ($5.6), Germany ($5.6), Italy ($2.7), Taiwan ($2.7), India ($2.7), South Korea ($2.2), Canada ($1.4), and France ($1.1).
- The deficit with China decreased $2.1 billion to $24.3 billion in September. Exports increased $0.8 billion to $12.0 billion and imports decreased $1.3 billion to $36.4 billion.
- The deficit with Mexico decreased $1.8 billion to $10.7 billion in September. Exports increased $1.3 billion to $18.5 billion and imports decreased $0.5 billion to $29.2 billion.
- The deficit with the European Union increased $1.6 billion to $17.3 billion in September. Exports increased $0.3 billion to $19.6 billion and imports increased $1.9 billion to $36.9 billion.
-----
Earlier:
2020, October, 29, 17:05:00
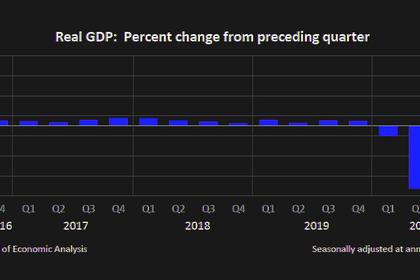
U.S. GDP UP 33%
U.S. Real gross domestic product (GDP) increased at an annual rate of 33.1 percent in the third quarter of 2020
2020, October, 19, 14:05:00
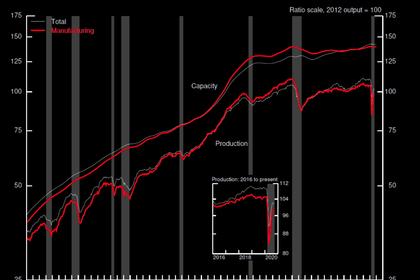
U.S. INDUSTRIAL PRODUCTION DOWN
U.S. industrial production fell 0.6 percent in September, its first decline after four consecutive months of gains.
2020, October, 16, 13:00:00
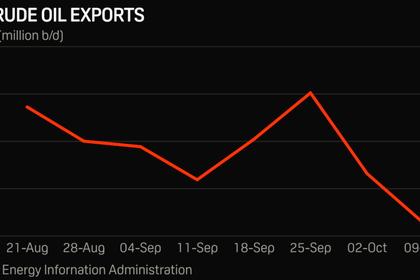
U.S. OIL EXPORTS DOWN
The US exported an average of 2.135 million b/d of crude over the weekend ended on Oct. 9, the lowest level since the week ended on August 2, 2019,
2020, October, 7, 10:25:00
U.S. INTERNATIONAL TRADE DEFICIT $67.1 BLN
The U.S. goods and services deficit was $67.1 billion in August, up $3.7 billion from $63.4 billion in July, revised.
2020, October, 6, 15:50:00
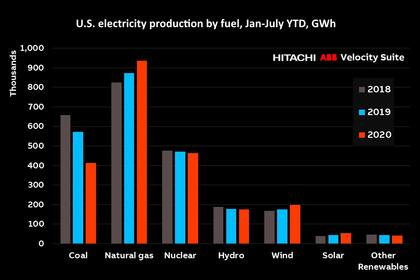
U.S. ENERGY UPDOWN
Driven by unprecedented low fuel prices, gas power production increased by 7.1% during the first seven months from last year, while coal dipped dramatically by 27.5%.
2020, October, 5, 13:20:00
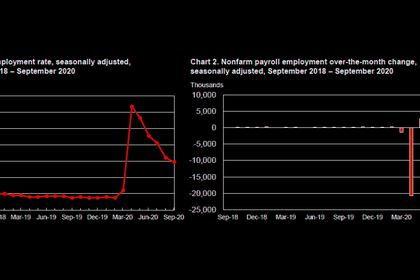
U.S. UNEMPLOYMENT DOWN TO 7.9%
Total U.S. nonfarm payroll employment rose by 661,000 in September, and the unemployment rate declined to 7.9 percent,


