2020-12-17 14:00:00


OECD GAS PRODUCTION DOWN
IEA - 16 Dec 2020 - MONTHLY OECD NATURAL GAS STATISTICS
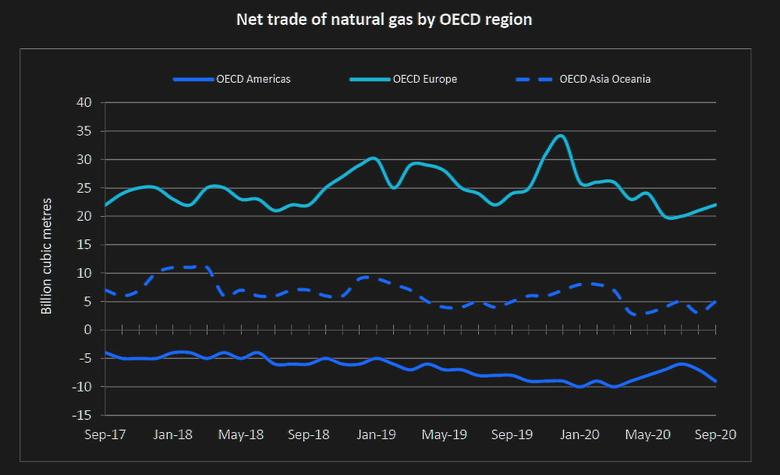
Total OECD indigenous production of natural gas decreased by 3.5% in September 2020 compared to September 2019, with decreases in both the OECD Americas and OECD Asia Oceania and an increase in OECD Europe. The negative trend was led by the OECD Americas (-4.6% y-o-y1), due to a production decline of 5.8% in the United States y-o-y. Production declined by 3.0% y-o-y in OECD Asia Oceania and rose in OECD Europe (4.0% y-o-y), where the positive trend was led by Norway (+37.0% y-o-y), whose increase appears high due to atypical low production last year. Overall, total OECD indigenous production of natural gas decreased by 1.2% on a year-to-date basis2.
Total OECD imports (entries)3 of natural gas declined by 0.4% in September 2020 on a year-on-year basis. This trend was led by the OECD Americas (-14.0% y-o-y) with a 16.1% y-o-y decrease of imports from OECD countries. Both OECD Europe and OECD Asia Oceania balanced the trend with an increase in imports of 1.4% and 0.8% year-on-year, respectively. In terms of pipeline and LNG split, a decrease was observed for LNG imports (-6.5% y-o-y) while pipeline imports increased (+1.9% y-o-y) in the total OECD.
Total OECD exports (exits)3 of natural gas increased by 2.7% in September 2020 compared to September 2019. Both the OECD Americas (-5.7% y-o-y) and OECD Asia Oceania (-0.1% y-o-y) experienced a decrease in exports. Following the same trend as for indigenous production, an increase in exports was observed in OECD Europe (+8.0% y-o-y), mainly to OECD countries (+14.8% y-o-y). Total OECD exports of LNG increased by 1.0% y-o-y, and the trend continued for pipeline exports with a 3.3% increase y-o-y.
Total OECD gross consumption of natural gas increased by 0.9% in September 2020 compared to the same month last year. Consumption declined in the OECD Americas (-1.1% y-o-y), driven mostly by decreases in the United States (-2.0% y-o-y) and Canada (-3.3% y-o-y). Meanwhile, consumption rose in OECD Europe (+3.4% y-o-y) and OECD Asia Oceania (+4.9% y-o-y). Overall, total OECD gross consumption of natural gas decreased by 2.4% on a year-to-date basis.
1. Year-on-year (y-o-y) change over corresponding month of previous year.
2. Year-to-date (y-t-d) change over corresponding period (beginning of year to current month) of previous year.
3. Transit volumes are included. Trade amounts include intra-regional trade.
-----
Earlier:

2020, December, 14, 12:50:00
NORD STREAM 2 RESUMED WORKS
"Nord Stream 2 confirms the resumption of pipelay works planned for Dec. 11," a project spokesman told
2020, December, 10, 12:05:00
EUROPEAN HYDROGEN DEVELOPMENT $110 BLN
The Green Hydrogen Catapult target will require investment of roughly $110 billion and deliver more than 120,000 jobs, according to the groups.
2020, December, 10, 11:50:00
U.S. LPG FOR ASIA IS STABLE
The ample US shipments come as Chinese petrochemical sector demand for propane feedstock held firm amid high domestic prices of propylene,
2020, December, 8, 12:50:00
U.S. LNG EXPORTS UP
LNG suppliers are continuing to respond to the uptick in demand and prices with the US now exporting at historically high volumes.
2020, December, 7, 13:10:00
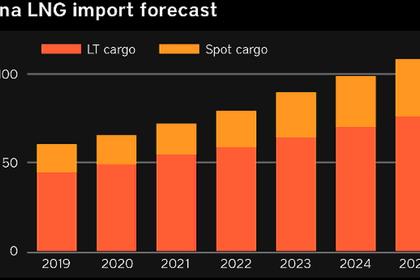
CHINA GAS IMPORTS UP
China's natural gas sales exceeded 950 million cu m/day across the nation, state-owned oil and gas infrastructure giant PipeChina said on its official WeChat on Nov. 21.
2020, December, 3, 11:30:00
EUROPE'S GHG EMISSIONS DOWN
Since 1990, GHG emissions in the EU have been steadily declining, with emissions in the EU 27 falling to 24% below their 1990 levels in 2019.
2020, November, 23, 12:35:00
EUROPEAN RENEWABLE TARGET $950 BLN
These objectives will require a total investment of close to EUR 800 billion (USD 949.5bn) between now and mid-century, the commission estimates.


