2020-12-07 12:55:00


U.S. ELECTRICITY DEMAND CHANGES
By ,
Mentioned: Avangrid Inc (AGR), Vistra Corp (VST), Dominion Energy Inc (D), WEC Energy Group Inc (WEC), CMS Energy Corp (CMS), Alliant Energy Corp (LNT), PPL Corp (PPL), Eversource Energy (ES), CenterPoint Energy Inc (CNP), Pinnacle West Capital Corp (PNW)
MORNINGSTAR - Nov 20, 2020 - The coronavirus pandemic hit utilities hard. U.S. electricity demand is set to fall nearly 3% this year, creating a stiff financial headwind for most utilities. In April and May, at the peak of the COVID-19 restrictions, electricity demand fell 5.8%, the largest two-month drop in 50 years of recordkeeping. Commercial and industrial demand is down more than 10%, a big hurdle for utilities in the Midwest and South to overcome. Higher residential lighting, air conditioning, and electronics use due to working from home, e-learning, and unemployment has brought some relief. Electricity demand has decoupled from economic trends during the last decade, but the pandemic shows that the economy still matters.
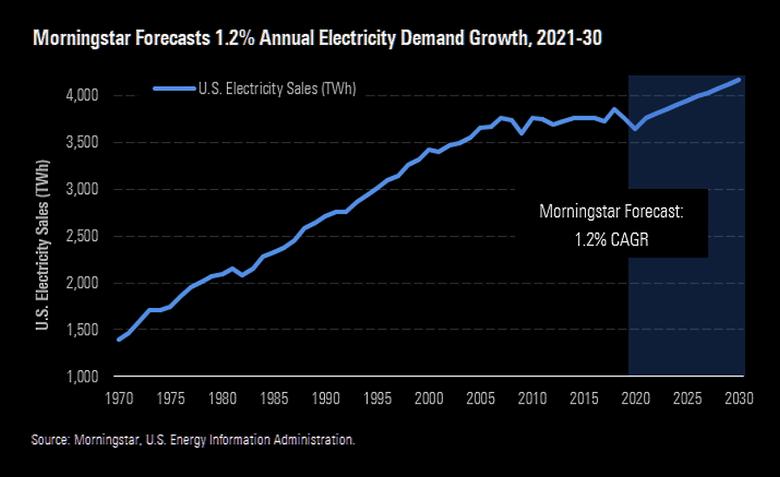
We forecast 1.2% average annual U.S. electricity demand growth through 2030, down slightly from our 1.25% average annual growth estimate published two years ago. The pandemic upended most energy forecasts, including ours, which is the primary reason our forecast is lower. Still, we remain more bullish than most industry forecasts even while assuming that energy efficiency remains a fierce headwind. Electricity is set to take share from other energy sources, such as coal, oil, and eventually natural gas. This offers utilities long-term infrastructure investment opportunities, supporting our 5.5% annual earnings growth outlook for the sector.
We expect electricity demand to bounce back to prepandemic levels next year as the economy recovers. In the long run, we continue to believe electricity demand will break out of a decadelong slump. U.S. electricity sales have been flat since the 2008-09 recession. However, electricity demand growth will remain tepid by historical standards. Our 1.2% average annual growth outlook is lower than any 10-year period before the 2008-09 recession and far below the 3.2% average annual growth rate of the last 70 years.
Our outlook combines a core growth forecast and our projections for fast-growing new sources of electricity demand such as data centers, electric vehicles, and cannabis cultivation. Our core growth forecast is based on Morningstar’s U.S. real gross domestic product forecast, the latest U.S. Census Bureau population forecast, and our outlook for changes in economic electricity intensity by state. Our core annual growth forecast is 1.0%, in line with our estimate in 2018.
Our growth estimate for new sources of electricity demand adds 20 basis points to our annual demand growth forecast. We estimate data centers, electric vehicles, and cannabis cultivation electricity use will represent 18% of new electricity demand during the next decade and grow to 5% of total U.S. electricity use by 2030, up from 3% now.
Our Base-Case Scenario
Our base-case 1.2% average annual growth scenario is based on the following assumptions:
- U.S. GDP rebounds to prepandemic levels in 2021 then grows 2.8% in 2022, 2.3% in 2023, and 2.2% in 2024. Thereafter, we assume 2% average annual GDP growth.
- Annual U.S. population growth averages 0.65% through 2030. This is based on the latest U.S. Census Bureau projections and state-specific trends during the last five years. Our population growth estimate is considerably slower than the 0.85% average annual rate during the last 20 years.
- Energy efficiency remains a large drag on electricity demand growth. We forecast U.S. electricity intensity of GDP falls 10% to 177 watt-hours per $1 of GDP in 2030 due to energy efficiency initiatives. Efficiency savings in California, Florida, and Texas have the biggest impact on our forecast.
New Sources of Electricity Demand
Electric vehicle charging adds 8 basis points of annual growth, the largest contribution of any new source. We expect electricity demand from EV charging to climb 400% by 2030, but the contribution to our overall growth rate is smaller because EV charging is a negligible share of electricity demand today. We assume EV and plug-in hybrid new-car sales climb to 20% of total U.S. new-car sales by 2030 and battery efficiency improves 10% each year. EVs account for 1% of total U.S. electricity demand by the end of our forecast in 2030.
Data centers add 7.5 basis points of annual growth. We forecast data center capacity doubles from 2019, but electricity demand growth is partially offset by 3% annual energy efficiency gains. Annual data center electricity demand grows 32% during the next decade and data centers account for 3% of total electricity demand by 2030.
Cannabis cultivation adds 4.5 basis points of annual growth. We assume 10% of the U.S. population regularly consumes a cannabis product by 2030, in line with rates in states that allow legal marijuana use. Annual cannabis cultivation electricity demand grows 65% during the next decade and accounts for 1% of total electricity demand by 2030.
Political Landscape
President-elect Joe Biden campaigned on a $2 trillion energy plan that aimed to make energy efficiency upgrades to 4 million buildings and weatherize 2 million homes during the next four years, among other energy investments. We still think Democrats in Congress or in progressive states will push for legislation that could include cash rebates and low-cost financing to upgrade and electrify home appliances as well as energy efficiency investments. Plans might also include support for building sustainable homes and housing units, which likely would draw less electricity from the central network.
The Democratic Party’s renewable energy and emissions-reduction goals could result in an electricity demand boom. One of the fastest ways to reduce emissions and fossil fuel use is to electrify the economy using renewable energy. Most notably, this includes transportation and commercial energy use. States with leading renewable energy goals, such as New York and California, have started to move in this direction. However, Democrats are also pushing energy efficiency incentives, potentially offsetting electricity demand growth.
Overall, though, we think political gridlock means near-term impacts on our forecast will be limited. Our population growth forecast could go slightly higher or lower depending on changes to immigration policy. This could have a material impact on certain state electricity demand growth but probably won’t have a material impact on nationwide demand.
How Our Forecasts Differ
The U.S. Energy Information Administration, which publishes the most widely cited U.S. long-term energy forecasts, estimated that U.S. electricity demand will grow 0.6% annually between 2021 and 2030 in its latest annual energy outlook published in January, about half of our 1.2% estimate. The EIA forecasts 0.9% in its high economic growth scenario, which is still below our estimate.

We think the EIA and other forecasts underestimate demand growth primarily because they implicitly assume electricity demand from emerging growth sources such as electric vehicles, data centers, and cannabis cultivation grow at the same rate as core electricity demand. These new sources add 20 basis points to our annual growth rate estimate but are not explicitly incorporated in the EIA forecast. The EIA also assumes slower real GDP growth in its reference case (1.9%) than Morningstar’s forecast (2.1%).
The EIA’s forecast came out before the COVID-19 pandemic hit the United States. In April, the EIA forecast electricity demand would drop 3.1% in 2020, down from its forecast for a 1% drop in its annual energy outlook published in January. We were more bullish than that forecast at the time. The EIA has since refined that 2020 outlook, now forecasting a 2.4% drop based on actual data through July, closer to our 2.9% estimate. The EIA has not released an updated outlook for 2021.
Regional Outlook Critical for Investors
Our state and regional forecasts are most important for investors, since utilities operate in distinct service territories. In some cases, our long-term regional outlooks differ from what the market appears to be assuming for utilities in those regions.
The mid-Atlantic electric grid operator, PJM, forecasts 0.7% average annual energy load growth during the next 10 years, according to its January 2020 long-term planning report. This is mostly in line with our annual core growth forecasts for large states in the region, such as Pennsylvania (0.8%), Ohio (0.6%), and Virginia (1.3%). We expect demand growth contribution from emerging new sources in the region will be similar to the U.S. average. PJM forecasts substantial data center load growth driving above-average electricity demand growth in Virginia, in line with our forecast. Large utilities that operate in this region include Exelon (EXC), Dominion Energy (D), Public Service Enterprise Group (PEG), PPL (PPL), and FirstEnergy (FE).
The Midwest electric grid operator, MISO, forecast 0.97% average annual electricity demand growth in its most recent long-term outlook published in November 2019, which is higher than our annual core growth forecasts for large states in the region, such as Michigan (0.3%), Wisconsin (0.2%), Illinois (0.2%), and Missouri (0.8%). We expect regional demand growth from electric vehicles and cannabis cultivation to outpace the U.S. average but data center growth to trail the U.S. average. Large utilities that operate in this region include Xcel Energy (XEL), CMS Energy (CMS), WEC Energy (WEC), and Alliant Energy (LNT).
The New England grid operator, ISO-NE, forecasts mostly flat peak demand after incorporating regional energy efficiency investments, slightly lower than our annual core growth forecasts for the two largest states in the region, Massachusetts (0.3%) and Connecticut (0.1%). Overall, our core growth forecast for the region is higher than ISO-NE’s forecast, but we also expect more energy efficiency savings than ISO-NE forecasts. We expect electric vehicle demand in particular to be higher in the Northeast than the U.S. average. Large utilities that operate in this region include Eversource Energy (ES) and Avangrid (AGR).
The Big Four states--Texas, California, Florida, and New York--manage their own electric grids and together accounted for 28% of 2019 U.S. electricity demand. We estimate that share will grow to 29% by 2030.
Everything is bigger in Texas, including electricity demand. The state has the highest electricity demand of any state and accounts for 11% of total U.S. electricity demand. We expect Texas to extend its lead during the next decade, reaching 13% of total U.S. electricity demand by 2030. Our 3% average annual growth forecast is more bullish than the Texas grid operator, ERCOT, which forecast 2% annual average demand growth in its 2021-25 Capacity, Demand, and Reserves report in May. Texas has the highest core demand growth rate in our forecast primarily due to higher-than-average 4.5% annual GDP growth, 1.6% annual population growth, and only modest energy efficiency savings. We expect emerging sources of demand will be a smaller contributor in Texas than in most states. Large utilities that operate in the state include NRG Energy (NRG), Vistra (VST), Sempra Energy (SRE), and CenterPoint Energy (CNP).
Trailing only Texas, California currently represents 7% of total U.S. electricity demand. We expect California to drop into third place with 6% market share by 2030, just behind Florida. Even though California has some of the most ambitious transportation and commercial electrification goals of any state, its electricity demand growth will be held back by large investments in energy efficiency. The state’s electricity intensity of GDP will fall 22% during the next 10 years in our forecast, trailing only its West Coast peers Oregon and Washington.
We expect Florida’s annual electricity demand to pass California’s by 2030, primarily due to its scorching 1.8% annual population growth in our forecast. Efficiency improvements excluding distributed generation can’t offset the state’s economic and population growth during the next decade. New customer additions for the state’s largest utility, NextEra Energy’s (NEE) Florida Power & Light, were up nearly 1.5% in 2019, and management expects nearly 2% electricity demand growth in 2020.
New York is the biggest wild card among the big states. We forecast just 0.3% annual electricity demand growth in 2022-30 due to a shrinking population, slower economic growth than the U.S. average, and substantial investments in energy efficiency. But New York is moving rapidly to electrify its economy as it seeks 100% renewable energy by 2040. If commercial building and transportation electrification pick up in the latter half of the decade, electricity demand growth could surpass our estimate.

Diminishing Returns and Climate Change
We think some of the more bearish electricity demand growth estimates ignore the diminishing returns from energy efficiency investments as efficiency improvements reach their maximum achievable limits. Returns on incremental energy efficiency investments likely will fall once the low-hanging fruit like lighting and appliances is picked. Economic electricity intensity fell 18% during the last decade and is down by one third since the early 1990s. We expect it to fall 12% during the next decade, slowing from a nearly 2% annual rate of decline during the last decade to a 1% annual rate of decline by 2030.
Weather often acts like energy efficiency, either reducing demand during cool summers or increasing demand during hot summers. We assume year-to-year weather variability normalizes at historical averages and has no long-term impact on our forecast. However, climate change could have a long-term impact that would offset energy efficiency gains. Warmer summers would likely lead to more electric cooling demand. July, August, and September account for about 30% of annual U.S. electricity demand. Warmer winters would reduce electricity demand, but likely not enough to offset the impact of warmer summers. This dynamic could shift as government policies encourage further electrification of the economy. Replacing natural gas with electric heating in homes and businesses could make electricity demand more sensitive to winter weather. However, increasing transportation electrification, data demand, and other year-round electricity demand would reduce the share of weather-sensitive electricity demand.

-----
Earlier:
2020, November, 26, 11:55:00
U.S. GDP UP 31%
U.S. Real gross domestic product (GDP) increased at an annual rate of 33.1 percent in the third quarter of 2020
2020, November, 25, 11:55:00
U.S. RENEWABLES INVESTMENT $55 BLN
US investment into wind and solar energy will total $55 billion in 2020
2020, November, 18, 14:10:00
U.S. INDUSTRIAL PRODUCTION UP
Industrial production rose 1.1 percent in October.
2020, November, 16, 12:20:00
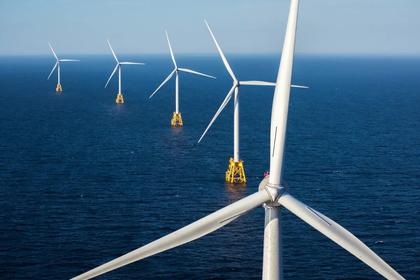
U.S. OFFSHORE WIND ENERGY UP
For the offshore wind sector in general, 2020 is shaping up to be a very successful and promising year.
2020, November, 13, 13:05:00
U.S. WIND ELECTRICITY WILL UP TO 10.3%
EIA forecasts wind’s share to reach 10.3% in 2021.


