2020-12-01 13:20:00


U.S. GAS PRODUCTION DOWN ANEW
U.S. EIA - November 30, 2020 - Data for September 2020
September 2020
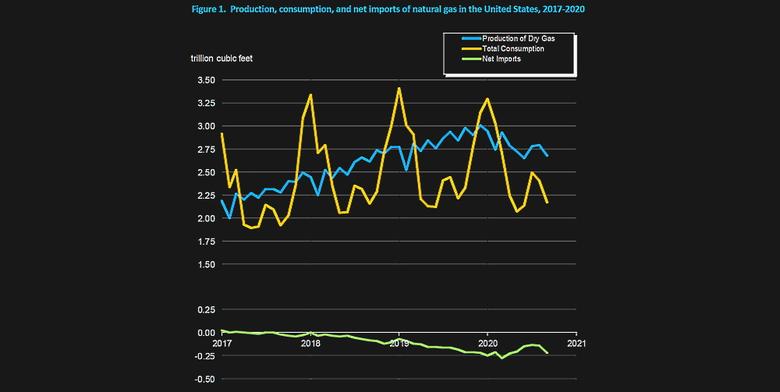
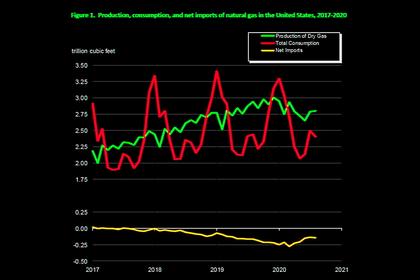
In September 2020, for the fifth consecutive month, dry natural gas production decreased year over year for the month. The preliminary level for dry natural gas production in September 2020 was 2,678 billion cubic feet (Bcf), or 89.3 Bcf/d. This level was 5.4 Bcf/d (-5.7%) lower than the September 2019 level of 94.7 Bcf/d. Despite this year-over-year decrease, the average daily rate of dry production was the second highest for the month since the U.S. Energy Information Administration (EIA) began tracking monthly dry production in 1973.
Estimated natural gas consumption in September 2020 was 2,173 Bcf, or 72.4 Bcf/d. This level was 1.5 Bcf/d (-2.0%) lower than the 73.9 Bcf/d consumed in September 2019. Despite this year-over-year decrease, the average daily rate of natural gas consumption for September 2020 was the second highest for the month since EIA began using the current definitions for consuming sectors in 2001.
The year-over-year average daily rate of consumption of dry natural gas in September 2020 increased in two of the four consuming sectors and decreased in the other two. Deliveries of natural gas by consuming sector in September 2020 were as follows:
Net natural gas imports (imports minus exports) were -220 Bcf, or -7.3 Bcf/d, in September 2020, making the United States a net exporter. Natural gas imports and exports in September 2020 were as follows:
- Residential deliveries: 125 Bcf for the month, or 4.2 Bcf/d
- Up 13.6% compared with 3.7 Bcf/d in September 2019. Residential deliveries were the highest for the month since 2003.
- Commercial deliveries: 142 Bcf for the month, or 4.7 Bcf/d
- Down 0.7% compared with 4.8 Bcf/d in September 2019. Commercial deliveries were the lowest for the month since 2016.
- Industrial deliveries: 651 Bcf for the month, or 21.7 Bcf/d
- Up 1.1% compared with 21.5 Bcf/d in September 2019. Industrial deliveries were the second highest for the month since EIA began using the current definitions for consuming sectors in 2001.
- Electric power deliveries: 1,037 Bcf for the month, or 34.6 Bcf/d
- Down 5.3% compared with 36.5 Bcf/d in September 2019. Despite this decrease, electric power deliveries were the second highest for the month since EIA began using the current definitions for consuming sectors in 2001.
- Net natural gas imports (imports minus exports) were -220 Bcf, or -7.3 Bcf/d, in September 2020, making the United States a net exporter. Natural gas imports and exports in September 2020 were as follows:
- Total imports: 174 Bcf for the month, or 5.8 Bcf/d
- Down 16.3% compared with 6.9 Bcf/d in September 2019. The average daily rate of natural gas imports was the lowest for any month since October 1992.
- Total exports: 395 Bcf for the month, or 13.16 Bcf/d
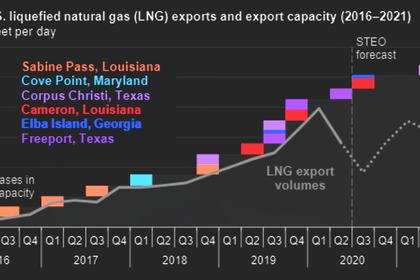
- Up 0.1% compared with 13.15 Bcf/d in September 2019. The average daily rate of natural gas exports was the highest for the month since EIA began tracking monthly exports in 1973. Liquefied natural gas (LNG) exports in September 2020 were down 5.6% compared with September 2019, as global LNG demand remains depressed. In September 2020, the United States exported 5.0 Bcf/d of LNG to 24 countries.
-----
Earlier:
2020, November, 17, 13:00:00
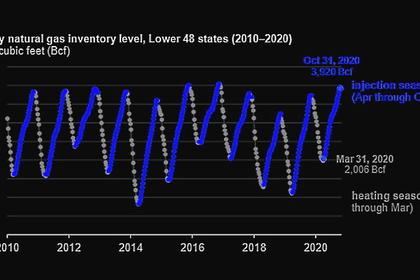
U.S. GAS INVENTORIES UP
The amount of working natural gas in storage in the United States ended the natural gas injection, or refill, season (April 1–October 31) at 3,920 billion cubic feet (Bcf),
2020, November, 13, 13:15:00
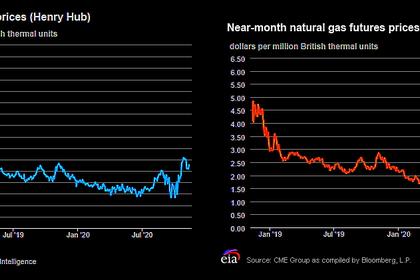
U.S. GAS PRICES UP TO $3
the natural gas spot price at the Henry Hub reached $3.00 per million British thermal units (MMBtu), its highest value since March 2019,
2020, November, 5, 12:05:00
U.S. LNG STOP $7 BLN
NextDecade is currently developing the 27 Mt/year LNG export project, which is facing opposition over environmental concerns.
2020, November, 3, 13:15:00
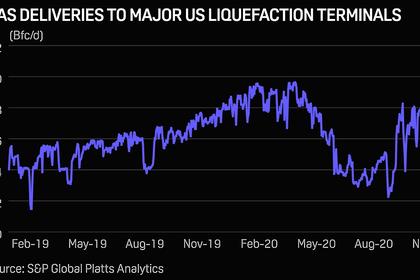
U.S. LNG DEMAND UP
Total US feedgas deliveries stood at 9.85 Bcf/d on Nov. 2, down from 10.02 Bcf/d the day before and 10.37 Bcf/d on Oct. 31
2020, November, 2, 17:15:00
U.S. GAS PRODUCTION DOWN
The preliminary level for dry natural gas production in August 2020 was 2,801 billion cubic feet (Bcf), or 90.4 Bcf/d. This level was 4.5 Bcf/d (-4.7%) lower than the August 2019 level of 94.8 Bcf/d.


