2020-12-23 12:50:00


U.S. GDP UP 33.4%
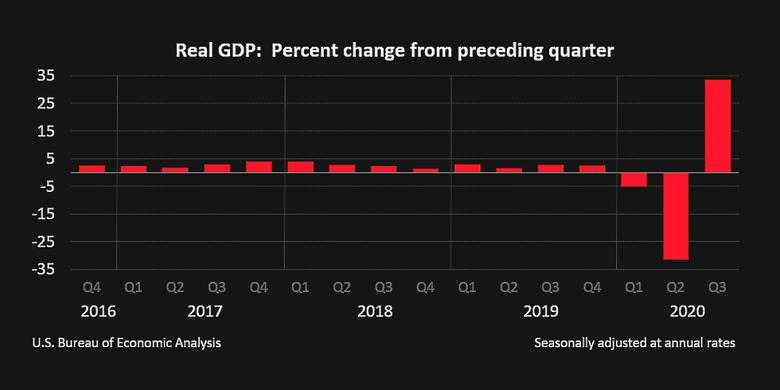
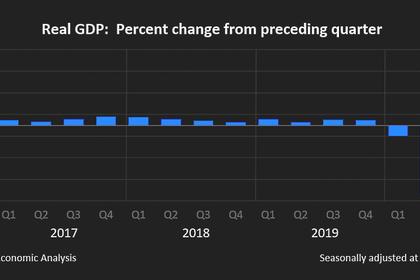
U.S. BEA- December 22, 2020 - Real gross domestic product (GDP) increased at an annual rate of 33.4 percent in the third quarter of 2020 (table 1), according to the "third" estimate released by the Bureau of Economic Analysis. In the second quarter, real GDP decreased 31.4 percent.
The “third” estimate of GDP released today is based on more complete source data than were available for the "second" estimate issued last month. In the second estimate, the increase in real GDP was 33.1 percent. The upward revision primarily reflected larger increases in personal consumption expenditures (PCE) and nonresidential fixed investment (see "Updates to GDP" on page 3).
The increase in real GDP reflected increases in PCE, private inventory investment, exports, nonresidential fixed investment, and residential fixed investment that were partly offset by decreases in federal government spending (reflecting fewer fees paid to administer the Paycheck Protection Program loans) and state and local government spending. Imports, which are a subtraction in the calculation of GDP, increased (table 2).
The increase in PCE reflected increases in services (led by health care as well as food services and accommodations) and goods (led by clothing and footwear as well as motor vehicles and parts). The increase in private inventory investment primarily reflected an increase in retail trade (led by motor vehicle dealers). The increase in exports primarily reflected an increase in goods (led by automotive vehicles, engines, and parts as well as capital goods). The increase in nonresidential fixed investment primarily reflected an increase in equipment (led by transportation equipment). The increase in residential fixed investment primarily reflected an increase in brokers’ commissions and other ownership transfer costs.
Current dollar GDP increased 38.3 percent at an annual rate, or $1.65 trillion, in the third quarter to a level of $21.17 trillion. In the second quarter, GDP decreased 32.8 percent, or $2.04 trillion (table 1 and table 3). More information on the source data that underlie the estimates is available in the "Key Source Data and Assumptions" file on BEA’s website.
The price index for gross domestic purchases increased 3.3 percent in the third quarter, in contrast to a decrease of 1.4 percent in the second quarter (table 4). The PCE price index increased 3.7 percent, in contrast to a decrease of 1.6 percent. Excluding food and energy prices, the PCE price index increased 3.4 percent, in contrast to a decrease of 0.8 percent.
Gross Domestic Income and Corporate Profits
Real gross domestic income (GDI) increased 25.8 percent in the third quarter, in contrast to a decrease of 32.6 percent in the second quarter. The average of real GDP and real GDI, a supplemental measure of U.S. economic activity that equally weights GDP and GDI, increased 29.6 percent in the third quarter, in contrast to a decrease of 32.0 percent in the second quarter (table 1).
Profits from current production (corporate profits with inventory valuation and capital consumption adjustments) increased $499.6 billion in the third quarter, in contrast to a decrease of $208.9 billion in the second quarter (table 10).
Profits of domestic financial corporations increased $12.1 billion in the third quarter, compared with an increase of $26.5 billion in the second quarter. Profits of domestic nonfinancial corporations increased $436.2 billion, in contrast to a decrease of $145.9 billion. Rest-of-the-world profits increased $51.3 billion, in contrast to a decrease of $89.5 billion. In the third quarter, receipts increased $113.0 billion, and payments increased $61.7 billion.
Updates to GDP
In the third estimate, the change in third-quarter real GDP was revised up 0.3 percentage point from the second estimate. The updated estimates primarily reflected upward revisions to consumer spending and nonresidential fixed investment that were partly offset by a downward revision to exports. For more information, see the Technical Note. For information on updates to GDP, see the "Additional Information" section that follows.
| Advance Estimate | Second Estimate | Third Estimate | |
| (Percent change from preceding quarter) | |||
| Real GDP | 33.1 | 33.1 | 33.4 |
| Current-dollar GDP | 38.0 | 38.0 | 38.3 |
| Real GDI | … | 25.5 | 25.8 |
| Average of Real GDP and Real GDI | … | 29.2 | 29.6 |
| Gross domestic purchases price index | 3.4 | 3.3 | 3.3 |
| PCE price index | 3.7 | 3.7 | 3.7 |
| PCE price index excluding food and energy | 3.5 | 3.5 | 3.4 |
Real GDP by Industry
Today’s release includes estimates of GDP by industry, or value added—a measure of an industry’s contribution to GDP. Private goods-producing industries increased 47.2 percent, private services-producing industries increased 35.1 percent, and government increased 10.1 percent (table 12).

Overall, 21 of 22 industry groups contributed to the third-quarter increase in real GDP (table 13). Within private goods-producing industries, the leading contributor to the increase was durable goods manufacturing (led by motor vehicles, bodies and trailers, and parts). Within private services-producing industries, the leading contributors to the increase were health care and social assistance (led by ambulatory health care); accommodation and food services (led by food services and drinking places); retail trade; and wholesale trade. The increase in government reflected increases in both state and local government and federal government. Offsetting these increases was a decrease in mining in the third quarter (led by support activities for mining).

Gross Output by Industry
Real gross output—principally a measure of an industry’s sales or receipts, which includes sales to final users in the economy (GDP) and sales to other industries (intermediate inputs)—increased 28.7 percent in the third quarter. Private goods-producing industries increased 33.6 percent, private services-producing industries increased 32.3 percent, and government increased 2.0 percent (table 16). Overall, 19 of 22 industry groups contributed to the increase in real gross output. Mining, federal government, and utilities gross output decreased.
-----
Earlier:
2020, December, 21, 12:35:00
U.S. CURRENT ACCOUNT DEFICIT UP TO $178.5 BLN
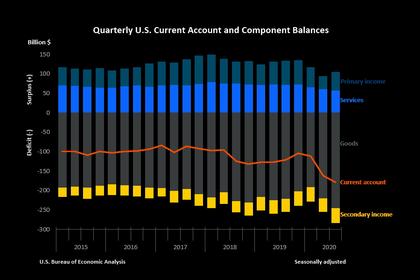
The U.S. current account deficit, which reflects the combined balances on trade in goods and services and income flows between U.S. residents and residents of other countries, widened by $17.2 billion, or 10.6 percent, to $178.5 billion in the third quarter of 2020
2020, December, 17, 13:40:00
U.S. FEDERAL FUNDS RATE 0.0 - 0.25% AGAIN
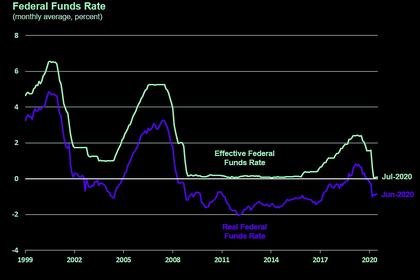
The Committee decided to keep the target range for the federal funds rate at 0 to 1/4 percent
2020, December, 16, 12:20:00
U.S. INDUSTRIAL PRODUCTION INCREASED
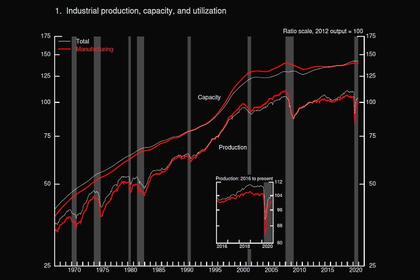
U.S. industrial production increased 0.4 percent in November.
2020, December, 8, 12:40:00
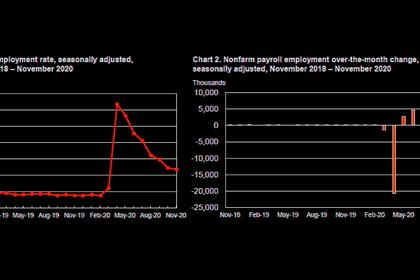
U.S. EMPLOYMENT UP BY 245,000
Total nonfarm payroll employment rose by 245,000 in November, and the unemployment rate edged down to 6.7 percent,
2020, December, 7, 13:05:00
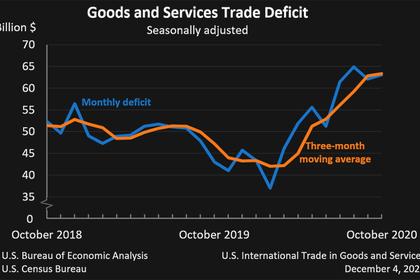
U.S. INTERNATIONAL TRADE DEFICIT UP TO $63 BLN
the U.S. goods and services deficit was $63.1 billion in October, up $1.0 billion from $62.1 billion in September
2020, December, 7, 12:55:00
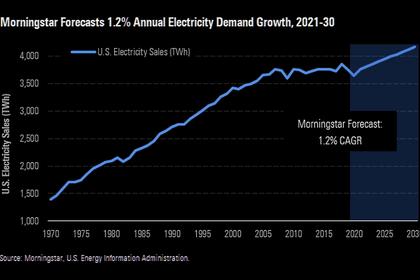
U.S. ELECTRICITY DEMAND CHANGES
In April and May, at the peak of the COVID-19 restrictions, electricity demand fell 5.8%, the largest two-month drop in 50 years of recordkeeping.
2020, November, 26, 11:55:00
U.S. GDP UP 31%
U.S. Real gross domestic product (GDP) increased at an annual rate of 33.1 percent in the third quarter of 2020


