
2020-12-07 13:05:00


U.S. INTERNATIONAL TRADE DEFICIT UP TO $63 BLN
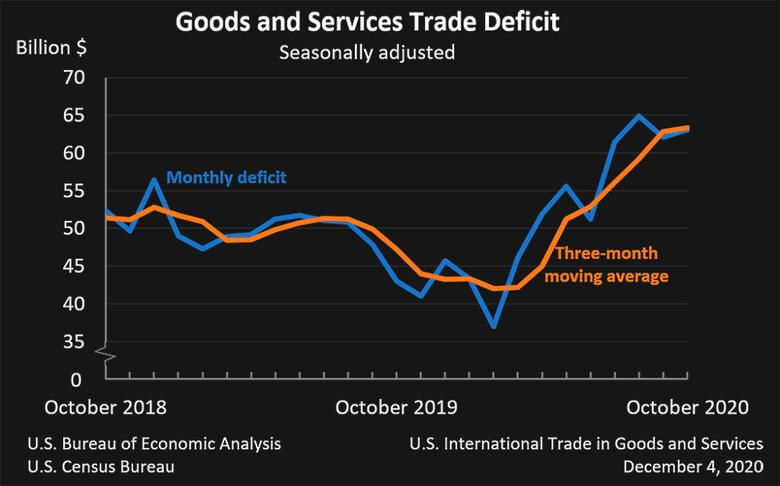
U.S. BEA - December 4, 2020 - U.S. International Trade in Goods and Services, October 2020
The U.S. Census Bureau and the U.S. Bureau of Economic Analysis announced today that the goods and services deficit was $63.1 billion in October, up $1.0 billion from $62.1 billion in September, revised.
| Deficit: |
$63.1 Billion |
+1.7%° |
| Exports: |
$182.0 Billion |
+2.2%° |
| Imports: |
$245.1 Billion |
+2.1%° |
|
Next release: January 7, 2021 (°) Statistical significance is not applicable or not measurable. Data adjusted for seasonality but not price changes Source: U.S. Census Bureau, U.S. Bureau of Economic Analysis; U.S. International Trade in Goods and Services, December 4, 2020 |
||
Exports, Imports, and Balance (exhibit 1)
October exports were $182.0 billion, $4.0 billion more than September exports. October imports were $245.1 billion, $5.0 billion more than September imports.
The October increase in the goods and services deficit reflected an increase in the goods deficit of $0.6 billion to $81.4 billion and a decrease in the services surplus of $0.4 billion to $18.3 billion.
Year-to-date, the goods and services deficit increased $46.6 billion, or 9.5 percent, from the same period in 2019. Exports decreased $345.9 billion or 16.4 percent. Imports decreased $299.4 billion or 11.5 percent.
Three-Month Moving Averages (exhibit 2)
The average goods and services deficit increased $0.6 billion to $63.4 billion for the three months ending in October.
- Average exports increased $4.0 billion to $178.0 billion in October.
- Average imports increased $4.6 billion to $241.3 billion in October.
Year-over-year, the average goods and services deficit increased $16.2 billion from the three months ending in October 2019.
- Average exports decreased $32.1 billion from October 2019.
- Average imports decreased $15.9 billion from October 2019.
Exports (exhibits 3, 6, and 7)
Exports of goods increased $3.7 billion to $126.3 billion in October.
Exports of goods on a Census basis increased $3.6 billion.
- Industrial supplies and materials increased $1.6 billion.
- Natural gas increased $0.5 billion.
- Organic chemicals increased $0.4 billion.
- Capital goods increased $1.5 billion.
- Civilian aircraft engines increased $0.7 billion.
- Semiconductors increased $0.4 billion.
Net balance of payments adjustments increased $0.1 billion.
Exports of services increased $0.3 billion to $55.7 billion in October.
- Travel increased $0.2 billion.
- Transport increased $0.2 billion.
Imports (exhibits 4, 6, and 8)
Imports of goods increased $4.3 billion to $207.8 billion in October.
Imports of goods on a Census basis increased $4.7 billion.
- Consumer goods increased $1.4 billion.
- Cell phones and other household goods increased $1.1 billion.
- Capital goods increased $1.4 billion.
- Computer accessories increased $0.6 billion.
- Other industrial machinery increased $0.3 billion.
- Industrial supplies and materials increased $1.3 billion.
- Nonmonetary gold increased $0.5 billion.
- Crude oil increased $0.4 billion.
- Automotive vehicles, parts, and engines increased $1.0 billion.
- Automotive parts and accessories increased $0.5 billion.
- Passenger cars increased $0.3 billion.
Net balance of payments adjustments decreased $0.4 billion.
Imports of services increased $0.7 billion to $37.4 billion in October.
- Travel increased $0.3 billion.
- Transport increased $0.3 billion.
Real Goods in 2012 Dollars – Census Basis (exhibit 11)
The real goods deficit increased $2.3 billion to $89.9 billion in October.
- Real exports of goods increased $3.7 billion to $143.7 billion.
- Real imports of goods increased $6.0 billion to $233.7 billion.
Revisions
Exports and imports of goods and services were revised for April through September 2020 to incorporate more comprehensive and updated quarterly and monthly data.
Revisions to September exports
- Exports of goods were revised down $0.1 billion.
- Exports of services were revised up $1.8 billion.
Revisions to September imports
- Imports of goods were revised down less than $0.1 billion.
- Imports of services were revised down $0.1 billion.
Goods by Selected Countries and Areas: Monthly – Census Basis (exhibit 19)
The October figures show surpluses, in billions of dollars, with South and Central America ($2.2), OPEC ($2.1), Hong Kong ($1.9), United Kingdom ($1.3), Saudi Arabia ($0.7), and Brazil ($0.5). Deficits were recorded, in billions of dollars, with China ($26.5), European Union ($15.7), Mexico ($11.8), Japan ($5.7), Germany ($5.2), South Korea, ($3.0), Taiwan ($3.0), India ($2.6), Italy ($2.5), Canada ($1.3), France ($0.9), and Singapore (less than $0.1).
- The deficit with China increased $2.2 billion to $26.5 billion in October. Exports increased $1.1 billion to $13.1 billion and imports increased $3.3 billion to $39.7 billion.
- The deficit with Mexico increased $1.1 billion to $11.8 billion in October. Exports increased $0.7 billion to $19.2 billion and imports increased $1.8 billion to $31.0 billion.
- The deficit with the European Union decreased $1.6 billion to $15.7 billion in October. Exports decreased $0.2 billion to $19.4 billion and imports decreased $1.8 billion to $35.2 billion.
Goods and Services by Selected Countries and Areas: Quarterly – Balance of Payments Basis
(exhibit 20)
Statistics on trade in goods and services by country and area are only available quarterly, with a one-month lag. With this release, third-quarter figures are now available.
The third-quarter figures show surpluses, in billions of dollars, with South and Central America ($12.2), OPEC ($7.4), Hong Kong ($5.1), Brazil ($4.9), United Kingdom ($4.3), Singapore ($3.2), Saudi Arabia ($2.6), and Canada ($2.0). Deficits were recorded, in billions of dollars, with China ($74.6), Mexico ($34.2), European Union ($31.1), Germany ($14.1), Japan ($12.8), India ($8.5), Taiwan ($7.3), Italy ($6.9), France ($5.9), and South Korea ($4.3).
- The deficit with Mexico increased $19.2 billion to $34.2 billion in the third quarter. Exports increased $15.6 billion to $58.8 billion and imports increased $34.8 billion to $92.9 billion.
- The deficit with the European Union increased $9.9 billion to $31.1 billion in the third quarter. Exports increased $10.4 billion to $98.5 billion and imports increased $20.3 billion to $129.6 billion.
- The surplus with Hong Kong increased $3.3 billion to $5.1 billion in the third quarter. Exports decreased $0.2 billion to $8.5 billion and imports decreased $3.5 billion to $3.3 billion.
-----
Earlier:
2020, November, 26, 11:55:00
U.S. GDP UP 31%
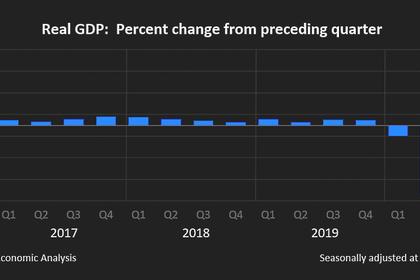
U.S. Real gross domestic product (GDP) increased at an annual rate of 33.1 percent in the third quarter of 2020
2020, November, 18, 14:10:00
U.S. INDUSTRIAL PRODUCTION UP
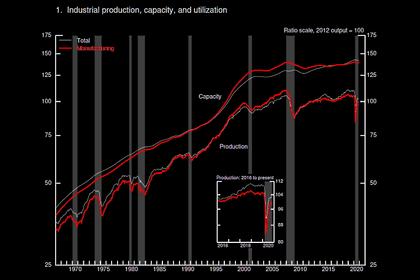
Industrial production rose 1.1 percent in October.
2020, November, 9, 13:05:00
U.S. UNEMPLOYMENT DOWN TO 6.9%
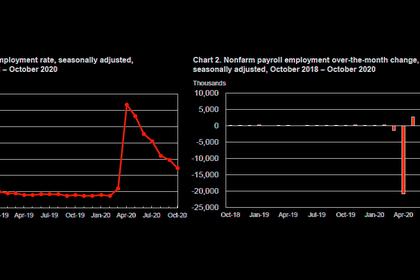
Total U.S. nonfarm payroll employment rose by 638,000 in October, and the unemployment rate declined to 6.9 percent,
2020, November, 6, 12:15:00
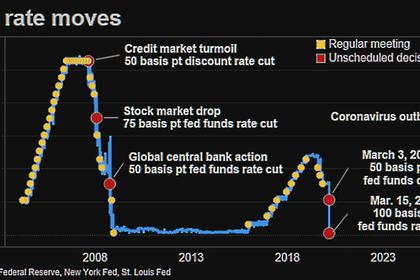
U.S. FEDERAL FUNDS RATE 0.0 - 0.25% ANEW
The Committee decided to keep the target range for the federal funds rate at 0 to 1/4 percent