2020-12-03 11:40:00


U.S. OIL, GAS M&A
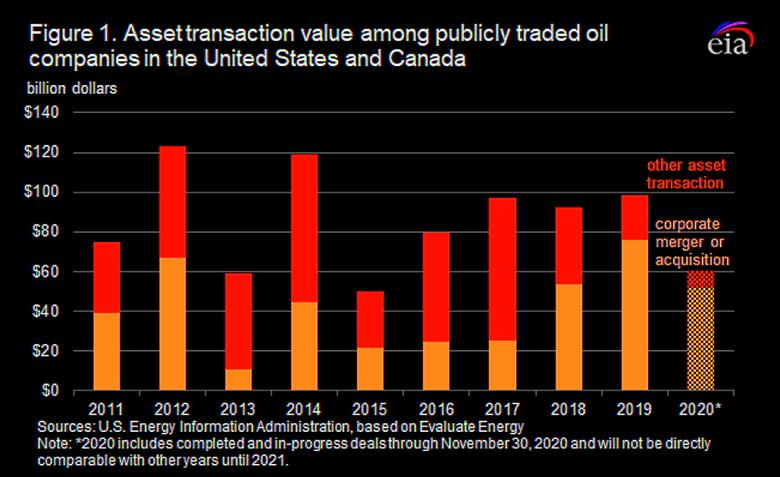
U.S. EIA - December 2, 2020 - Corporate acquisitions accounted for most oil company asset transaction value in the United States and Canada so far in 2020
Through November 30, the number of total transactions involving oil and natural gas assets among oil producers in the United States and Canada in 2020 is on pace to be the lowest since at least 2011. Although the number of transactions is approaching a 10-year low, the transactions this year have involved larger values on average because a majority were large corporate merger and acquisition (M&A) deals as opposed to individual asset deals, such as acreage sales.
Including completed and announced deals in progress through November 30, asset transactions in the United States and Canada totaled $60 billion, which, absent any deal cancellations or new deal announcements in December, would mean the preliminary transaction value for 2020 was the lowest since 2015 (Figure 1). Transactions declined amid significant oil market volatility during the first half of 2020, but have since increased. Since 2011, business closures and increased corporate consolidation have outpaced the creation of new publicly traded oil companies, which has resulted in a net decline in the number of publicly traded oil companies in the United States and Canada. In addition, corporate consolidation has broadly contributed to lower administrative expenses per barrel, based on EIA analysis of company financial statements.
Corporate M&A or other asset transactions can be attractive for both buyers and sellers. Buyers could purchase proved reserves instead of using capital expenditures on exploration and development that might never generate profitable assets. Some companies may also wish to diversify their portfolios or purchase acreage that geographically complements their existing portfolios, which can lead to lower costs and greater production efficiency. Sellers may see selling property or merging companies as beneficial for shareholders or, in some cases, may seek out buyers as a way to emerge from bankruptcy proceedings and improve balance sheets.
Companies can also save administrative overhead costs through mergers. These overhead costs (called selling, general, and administrative expenses, or SG&A, on a company’s income statement) include expenditures on marketing, accounting, human resources, or other costs not tied directly to crude oil and petroleum liquids production.
Among publicly traded oil companies on stock exchanges in the United States and Canada, weighted-average SG&A costs per barrel of oil equivalent (BOE) declined 49% from $6.39/BOE to $3.26/BOE between the first quarter of 2011 and the second quarter of 2020 (Figure 2). M&A and consolidation among these companies is not the only explanation for the decline in weighted-average SG&A expenses. EIA analysis of company income statements identified several companies that reduced their SG&A expenses per BOE during this period but did not merge or acquire other companies, meaning individual companies have taken other steps to minimize overhead and administrative expenses. Yet M&A still likely contributed to the decline in weighted-average SG&A expenses, particularly because consolidation into a single corporate headquarters can reduce duplicative overhead expenditures. Consolidation through M&A, as well as business closures and fewer oil company public offerings, has resulted in a net decline in the number of publicly traded oil companies in the United States and Canada, from a peak of 252 companies in the second quarter of 2014 to 191 as of the second quarter of 2020.
 declined 49% from $6.39/BOE to $3.26/BOE between the first quarter of 2011 and the second quarter of 2020")
Through November 2020, corporate M&A deals have accounted for 85% of the total asset transaction value, higher than the 2011–19 average of 44%, making 2020 the third consecutive year in which the corporate M&A value made up a bigger share of the value of all transactions than asset deals. In addition, M&A deals accounted for 20% of the number of all asset transactions, also a bigger share than its 2011–19 average of 11%. Some of the more notable deals announced this year include those between large companies.
- ConocoPhillips announced it will acquire Concho Resources for a total acquisition cost of $13.3 billion. Although the deal is still in progress, ConocoPhillips claims the acquisition will achieve $0.5 billion in cost and capital savings by 2022. ConocoPhillips produced 1.35 million BOE per day (d) in 2019 from a variety of global assets, and Concho Resources produced 331,000 BOE/d from the Delaware and Midland Basins in the Permian region of the United States.
- Chevron Corporation acquired Noble Energy, Inc., for a total acquisition cost of $13.0 billion. Chevron produced 3.06 million BOE/d globally in 2019, and Noble produced 361,000 BOE/d primarily in the United States with some additional production in Africa.
- Pioneer Natural Resources Company will acquire Parsley Energy, Inc., for a total acquisition cost of $7.6 billion. The deal, which is still in progress, could achieve annual cost savings of $325 million, according to Pioneer Natural Resources’ press release. Each company has production only in the Permian region in the United States. Pioneer Natural Resources produced 346,000 BOE/d in 2019, and Parsley produced 141,000 BOE/d.
- Cenovus Energy will merge with Husky Energy for a total transaction cost of $7.6 billion in a deal expected to close by the first quarter of 2021. Both corporations operate primarily oil sands production assets in Canada, and both have equity stakes in or own refineries in the United States configured to process heavy oil sands production from Canada. In 2019, Cenovus Energy and Husky Energy produced 452,000 BOE/d and 290,000 BOE/d, respectively. After the merger, the combined company will become the third-largest oil producer in Canada.
- Devon Energy Corporation will merge with WPX Energy, Inc. Still in progress, the deal has a total transaction cost of $5.7 billion. Devon Energy operates exclusively in the United States, primarily in the Anadarko and Permian regions, and its 2019 annual production averaged 427,000 BOE/d. WPX Energy has assets in the Bakken and Permian regions, and it produced 167,000 BOE/d in 2019.
- Bonanza Creek Energy, Inc., is in the process of merging with HighPoint Resources Corporation for a total transaction cost of $1.0 billion. Both companies produce in the Niobrara region of the United States and produced 23,000 BOE/d and 34,000 BOE/d in 2019, respectively.
These and other M&A deals are contributing to the trend toward fewer publicly traded oil companies operating in the United States and Canada, resulting in larger companies that own more producing assets and have higher market capitalization.
U.S. average regular gasoline and diesel prices increase
The U.S. average regular gasoline retail price increased nearly 2 cents to $2.12 per gallon on November 30, 46 cents lower than the same time last year. The East Coast price increased more than 3 cents to $2.11 per gallon, the Gulf Coast price increased nearly 2 cents to $1.79 per gallon, the Midwest price increased nearly 1 cent to $1.95 per gallon, the West Coast price increased nearly 1 cent, remaining virtually unchanged at $2.77 per gallon, and the Rocky Mountain price increased less than 1 cent, remaining virtually unchanged at $2.18 per gallon.
The U.S. average diesel fuel price increased 4 cents to $2.50 per gallon on November 30, 57 cents lower than a year ago. The Midwest price increased nearly 5 cents to $2.40 per gallon, the Gulf Coast price increased more than 4 cents to $2.25 per gallon, the East Coast and West Coast prices each increased more than 3 cents to $2.54 per gallon and $3.04 per gallon, respectively, and the Rocky Mountain price increased nearly 3 cents to $2.54 per gallon.
Propane/propylene inventories decline
U.S. propane/propylene stocks decreased by 0.8 million barrels last week to 91.7 million barrels as of November 27, 2020, 5.8 million barrels (6.8%) greater than the five-year (2015-19) average inventory levels for this same time of year. Gulf Coast, East Coast, and Midwest inventories decreased by 0.6 million barrels, 0.3 million barrels, and 0.1 million barrels, respectively. Rocky Mountain/West Coast inventories increased by 0.1 million barrels.
Residential heating fuel prices increase
As of November 30, 2020, residential heating oil prices averaged more than $2.26 per gallon, more than 6 cents per gallon above last week’s price but nearly 74 cents per gallon lower than last year’s price at this time. Wholesale heating oil prices averaged almost $1.49 per gallon, more than 10 cents per gallon above last week’s price but nearly 56 cents per gallon lower than last year.
Residential propane prices averaged almost $1.86 per gallon, less than 1 cent per gallon above last week’s price but more than 17 cents per gallon below last year’s price. Wholesale propane prices averaged nearly $0.68 per gallon, almost 3 cents per gallon above last week’s price but 23 cents per gallon below last year’s price.
-----
Earlier:
2020, November, 26, 11:40:00
U.S. RIGS UP 10 TO 320
U.S. Rig Count is up 10 from last week to 320 , Canada Rig Count is up 1 from last week to 102,
2020, November, 19, 14:25:00
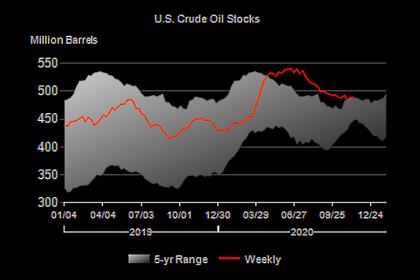
U.S. OIL INVENTORIES UP 0.8 MB TO 489.5 MB
U.S. commercial crude oil inventories increased by 0.8 million barrels to 489.5 million barrels
2020, November, 18, 14:30:00
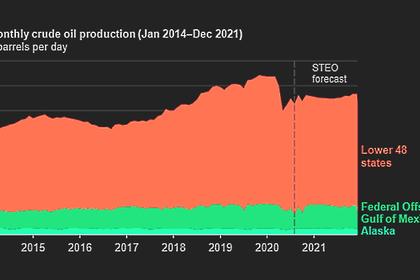
U.S. OIL PRODUCTION WILL BE 10.6 MBD
By August production of crude oil had risen to 10.6 million b/d in the United States,
2020, November, 17, 13:00:00
U.S. GAS INVENTORIES UP
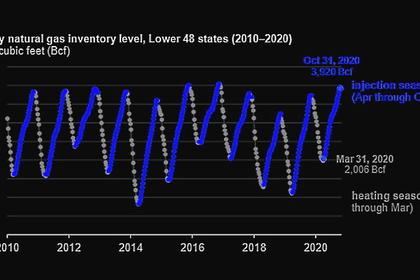
The amount of working natural gas in storage in the United States ended the natural gas injection, or refill, season (April 1–October 31) at 3,920 billion cubic feet (Bcf),
2020, November, 3, 13:15:00
U.S. LNG DEMAND UP
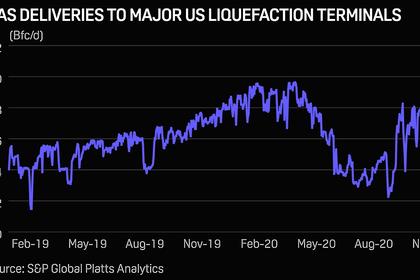
Total US feedgas deliveries stood at 9.85 Bcf/d on Nov. 2, down from 10.02 Bcf/d the day before and 10.37 Bcf/d on Oct. 31


