2020-02-17 12:00:00


U.S. GAS PRICES: THE LOWEST LEWEL
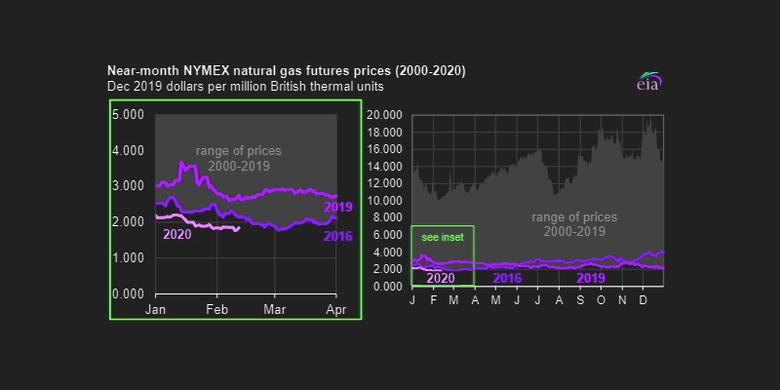
U.S. EIA - FEBRUARY 14, 2020 - This winter, natural gas prices have been at their lowest levels in decades. On Monday, February 10, the near-month natural gas futures price at the New York Mercantile Exchange (NYMEX) closed at $1.77 per million British thermal units (MMBtu). This price was the lowest February closing price for the near-month contract since at least 2001, in real terms, and the lowest near-month futures price in any month since March 8, 2016, according to Bloomberg, L.P. and FRED data.
In addition, according to Natural Gas Intelligence data, the daily spot price at the Henry Hub national benchmark was $1.81/MMBtu on February 10, 2020, the lowest price in real terms since March 9, 2016. Henry Hub spot prices have ranged between $1.81/MMBtu and $2.84/MMBtu this winter heating season (since November 1, 2019), generally because relatively warm winter weather has reduced demand for natural gas for heating. Natural gas production growth has outpaced demand growth, reducing the need to withdraw natural gas from underground storage.
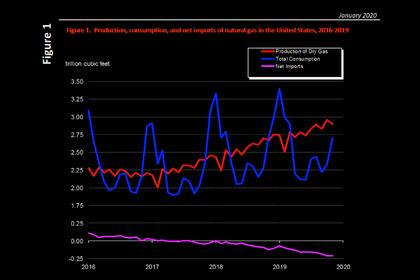
Dry natural gas production in January 2020 averaged about 95.0 billion cubic feet per day (Bcf/d), according to IHS Markit data. IHS Markit also estimates that in January 2020 the United States saw the third-highest monthly U.S. natural gas production on record, down slightly from the previous two months.
IHS Markit estimates that U.S. natural gas consumption by residential, commercial, industrial, and electric power sectors averaged 96 Bcf/d for January, which was about 4.4 Bcf/d less than the average for January 2019, largely because of decreases in residential and commercial consumption as a result of warmer temperatures.
However, IHS Markit estimates that overall consumption of natural gas (including feed gas to liquefied natural gas (LNG) export facilities, pipeline fuel losses, and net exports by pipeline to Mexico) averaged about 117.5 Bcf/d in January 2020, an increase of about 0.2 Bcf/d from last year. This overall increase is largely a result of an almost doubling of LNG feed gas to about 8.5 Bcf/d.
Because supply growth has outpaced demand growth, less natural gas has been withdrawn from storage withdrawals this winter. Despite starting the 2019–20 heating season with the third-lowest level of natural gas inventory since 2009, by January 17, 2020, working natural gas inventories reached relatively high levels for mid-winter. The U.S. Energy Information Administration’s (EIA) data on natural gas inventories for the Lower 48 states as of February 7, 2020, reflect a 215 Bcf surplus to the five-year average. In EIA’s latest short-term forecast, more natural gas remains in storage levels than the previous five-year average through the remainder of the winter.

According to the National Oceanic and Atmospheric Administration (NOAA), January 2020 was the fifth-warmest in its 126-year climate record. Heating degree days (HDDs), a temperature-based metric for heating demand, have been relatively low this winter, which is consistent with a warmer winter. During some weeks in late December and early January, the United States saw 25% to 30% fewer HDDs than the 30-year average. This winter, through February 8, residential natural gas customers in the United States have seen 11% fewer HDDs than the 30-year average.

-----
Earlier:
2020, February, 12, 12:00:00
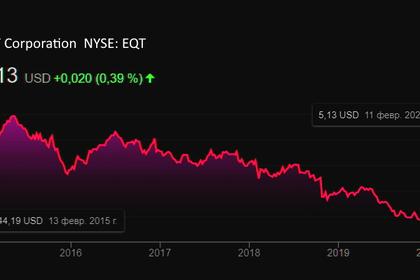
U.S. SHALE GAS WRITE-DOWNS
EQT Corp, the largest U.S. gas producer, recently said it would take a write-down of as much as $1.8 billion, following CNX Resources Corp, Royal Dutch Shell Plc and Chevron Corp in reducing the value of gas properties.
2020, February, 10, 10:30:00
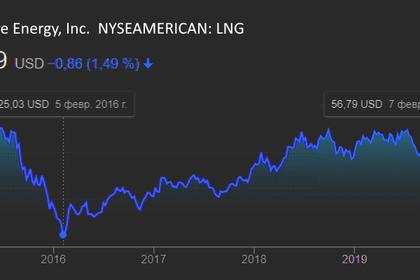
U.S. LNG COMPANIES DOWN
U.S. gas producers are counting on LNG exports to absorb record production from the shale boom. Those exports jumped 68% to a record 5.0 billion cubic feet per day in 2019 after soaring 53% in 2018.
2020, February, 5, 11:05:00
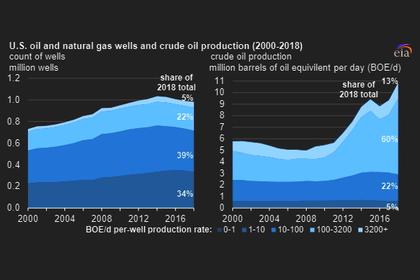
U.S. OIL & GAS PRODUCTION UP
In 2018, while production was increasing, the total number of wells producing crude oil and natural gas in the United States fell to 982,000, down from a peak of 1,035,000 wells in 2014.
2020, February, 3, 11:50:00
U.S. GAS PRODUCTION UP 8.3%
The preliminary level for dry natural gas production in November 2019 was 2,896 billion cubic feet (Bcf), or 96.5 Bcf/d. This level was 7.4 Bcf/d (8.3%) higher than the November 2018 level of 89.2 Bcf/d.


