2020-02-03 11:50:00


U.S. GAS PRODUCTION UP 8.3%
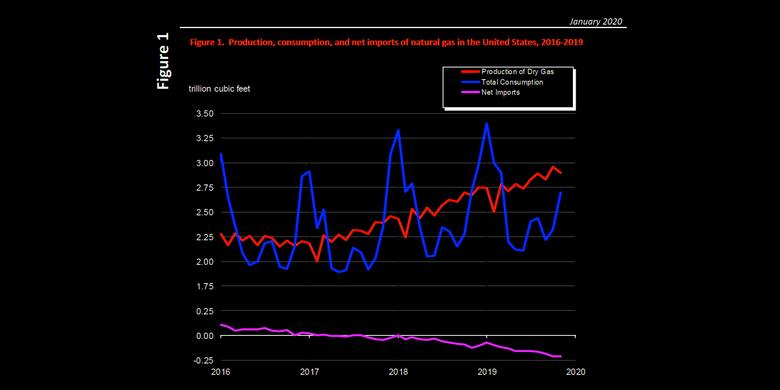
U.S. EIA - January 31, 2020 - Natural Gas Monthly November 2019
- In November 2019, for the 31st consecutive month, dry natural gas production increased year to year for the month. The preliminary level for dry natural gas production in November 2019 was 2,896 billion cubic feet (Bcf), or 96.5 Bcf/d. This level was 7.4 Bcf/d (8.3%) higher than the November 2018 level of 89.2 Bcf/d. The average daily rate of dry production was the highest for any month since EIA began tracking monthly dry production in 1997.
- The estimated natural gas consumption in November 2019 was 2,698 Bcf, or 89.9 Bcf/d. This level was 0.4 Bcf/d (0.4%) lower than the 90.3 Bcf/d consumed in November 2018. Despite this decrease, natural gas consumption for November was the second-highest level for the month since 2001, when EIA began using the current definitions for consuming sectors.
- Year-over-year total consumption of dry natural gas in November 2019 decreased in three of the four consuming sectors. Deliveries of natural gas by consuming sector in November 2019 were:
- Residential deliveries: 545 Bcf for the month, or 18.2 Bcf/d
• Down 9.0% compared with 20.0 Bcf/d in November 2018. - Commercial deliveries: 362 Bcf for the month, or 12.1 Bcf/d • Down 6.2% compared with 12.9 Bcf/d in November 2018. Despite this decrease, commercial deliveries were the second highest for the month since EIA began tracking them in 1973.
- Industrial deliveries: 729 Bcf for the month, or 24.3 Bcf/d • Down 0.4% compared with 24.4 Bcf/d in November 2018. Despite this decrease, industrial deliveries were the second highest for the month since EIA began using the current definitions for consuming sectors in 2001.
- Electric power deliveries: 821 Bcf for the month, or 27.4 Bcf/d • Up 7.6% compared with 25.4 Bcf/d in November 2018. Electric power deliveries were the highest for the month since EIA began using the current definitions for consuming sectors in 2001.
- Residential deliveries: 545 Bcf for the month, or 18.2 Bcf/d
- Net natural gas imports (imports minus exports) were -216 Bcf, or -7.2 Bcf/d, in November 2019, making the United States a net exporter. Natural gas imports and exports in November 2019 were:
- Total imports: 224 Bcf for the month, or 7.5 Bcf/d
• Up 5.7% compared with 7.1 Bcf/d in November 2018, the first year-to-year increase for any month since April 2018. - Total exports: 440 Bcf for the month, or 14.7 Bcf/d • Up 30.2% compared with 11.3 Bcf/d in November 2018. Natural gas exports were the highest for any month since EIA began tracking monthly exports in 1973. Liquefied natural gas (LNG) continues to drive the year-on-year increase in exports. LNG exports in November 2019 were 75.9% higher than in November 2018. In November 2019, the United States exported 6.3 Bcf/d of LNG to 22 countries. LNG exports were the highest for any month since EIA began tracking them in 1997.
- Total imports: 224 Bcf for the month, or 7.5 Bcf/d
-----
Earlier:
2020, January, 24, 13:20:00
U.S. GAS EXPORTS UP TWICE
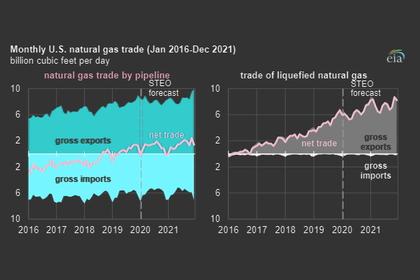
The U.S. Energy Information Administration (EIA) forecasts that U.S. natural gas exports will exceed natural gas imports by an average 7.3 billion cubic feet per day (Bcf/d) in 2020 (2.0 Bcf/d higher than in 2019) and 8.9 Bcf/d in 2021. Growth in U.S. net exports is led primarily by increases in liquefied natural gas (LNG) exports and pipeline exports to Mexico. Net natural gas exports more than doubled in 2019, compared with 2018, and EIA expects that they will almost double again by 2021 from 2019 levels.
2020, January, 22, 12:40:00
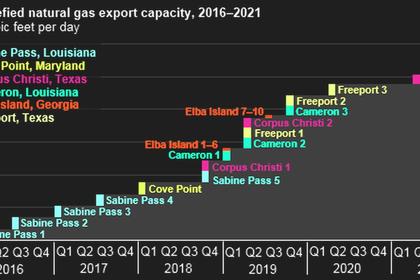
U.S. LNG PRODUCTION UP TO 9 BCFD
Total US LNG feedgas volumes reached a new all-time high of 9.4 Bcf/d Tuesday, after exceeding 9 Bcf/d for the first time on January 19.
2020, January, 15, 12:40:00
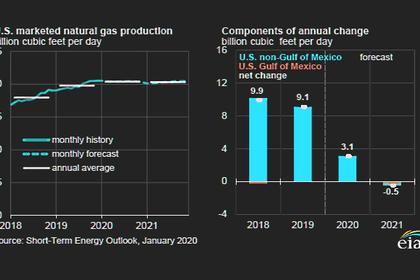
U.S. GAS WILL DOWN
U.S. dry gas production will fall to 94.11 billion cubic feet per day (bcfd) in 2021 from a record 94.74 bcfd in 2020. The current all-time high is 92.03 bcfd in 2019.


