2020-02-07 10:20:00


U.S. INTERNATIONAL TRADE DEFICIT $48.9 BLN
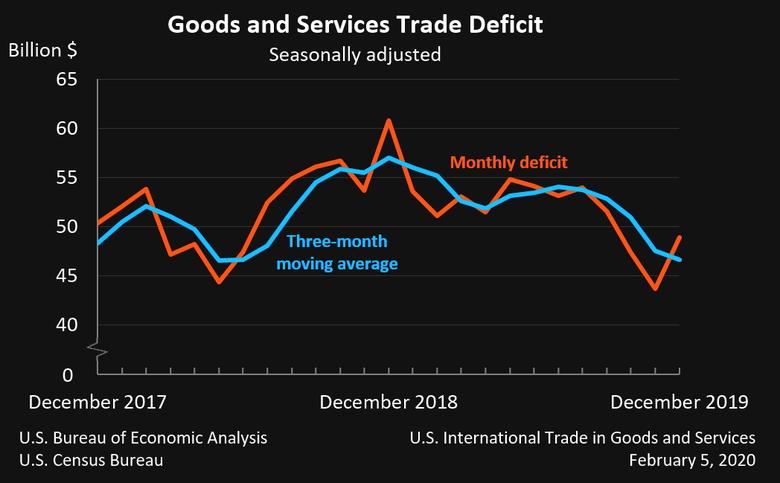
U.S. BEA - FEBRUARY 5, 2020 - The U.S. Census Bureau and the U.S. Bureau of Economic Analysis announced today that the goods and services deficit was $48.9 billion in December, up $5.2 billion from $43.7 billion in November, revised.
| Deficit: | $48.9 Billion | +11.9%° |
| Exports: | $209.6 Billion | +0.8%° |
| Imports: | $258.5 Billion | +2.7%° |
|
Next release: March 6, 2020 (°) Statistical significance is not applicable or not measurable. Data adjusted for seasonality but not price changes Source: U.S. Census Bureau, U.S. Bureau of Economic Analysis; U.S. International Trade in Goods and Services, February 5, 2020 |
||
Exports, Imports, and Balance (exhibit 1)
December exports were $209.6 billion, $1.6 billion more than November exports. December imports were $258.5 billion, $6.8 billion more than November imports.
The December increase in the goods and services deficit reflected an increase in the goods deficit of $5.1 billion to $69.7 billion and a decrease in the services surplus of $0.1 billion to $20.8 billion.
For 2019, the goods and services deficit decreased $10.9 billion, or 1.7 percent, from 2018. Exports decreased $1.5 billion or 0.1 percent. Imports decreased $12.5 billion or 0.4 percent.
Three-Month Moving Averages (exhibit 2)
The average goods and services deficit decreased $0.9 billion to $46.6 billion for the three months ending in December.
- Average exports increased $0.9 billion to $208.2 billion in December.
- Average imports decreased less than $0.1 billion to $254.8 billion in December.
Year-over-year, the average goods and services deficit decreased $10.4 billion from the three months ending in December 2018.
- Average exports increased $0.2 billion from December 2018.
- Average imports decreased $10.2 billion from December 2018.
Exports (exhibits 3, 6, and 7)
Exports of goods increased $1.3 billion to $137.7 billion in December.
Exports of goods on a Census basis increased $1.3 billion.
- Industrial supplies and materials increased $1.7 billion.Other goods increased $1.0 billion.
- Crude oil increased $1.5 billion.
- Automotive vehicles, parts, and engines decreased $1.0 billion.
- Passenger cars decreased $0.6 billion.
Net balance of payments adjustments increased less than $0.1 billion.
Exports of services increased $0.3 billion to $71.9 billion in December.
- Travel increased $0.2 billion.
- Other business services increased $0.1 billion.
Imports (exhibits 4, 6, and 8)
Imports of goods increased $6.4 billion to $207.5 billion in December.
Imports of goods on a Census basis increased $6.2 billion.
- Industrial supplies and materials increased $4.0 billion.Other goods increased $1.2 billion.
- Crude oil increased $1.7 billion.
- Nonmonetary gold increased $0.9 billion.
- Other petroleum products increased $0.6 billion.
Net balance of payments adjustments increased $0.1 billion.
Imports of services increased $0.4 billion to $51.1 billion in December.
- Travel increased $0.2 billion.
- Transport increased $0.1 billion.
Real Goods in 2012 Dollars – Census Basis (exhibit 11)
The real goods deficit increased $4.3 billion to $80.5 billion in December.
- Real exports of goods increased $1.5 billion to $149.3 billion.
- Real imports of goods increased $5.8 billion to $229.8 billion.
Revisions
In addition to revisions to source data for the November statistics, the seasonally adjusted goods data were revised for January through November so that the totals of the seasonally adjusted months equal the annual totals.
Revisions to November exports
- Exports of goods were revised down $0.7 billion.
- Exports of services were revised up $0.1 billion.
Revisions to November imports
- Imports of goods were revised up less than $0.1 billion.
- Imports of services were revised up less than $0.1 billion.
Goods by Selected Countries and Areas: Monthly – Census Basis (exhibit 19)
The December figures show surpluses, in billions of dollars, with South and Central America ($4.6), Hong Kong ($1.9), Brazil ($0.9), OPEC ($0.7), United Kingdom ($0.6), Singapore ($0.5), and Saudi Arabia ($0.3). Deficits were recorded, in billions of dollars, with China ($25.7), European Union ($14.0), Mexico ($9.4), Germany ($5.5), Japan ($4.4), Canada ($4.4), Italy ($2.9), Taiwan ($2.4), South Korea ($1.9), India ($1.7), and France ($0.3).
- The deficit with Canada increased $2.4 billion to $4.4 billion in December. Exports increased $0.1 billion to $23.9 billion and imports increased $2.5 billion to $28.2 billion.
- The deficit with Mexico increased $0.9 billion to $9.4 billion in December. Exports decreased $0.6 billion to $20.2 billion and imports increased $0.3 billion to $29.6 billion.
- The deficit with Japan decreased $1.3 billion to $4.4 billion in December. Exports increased $0.9 billion to $6.7 billion and imports decreased $0.4 billion to $11.1 billion.
Annual Summary for 2019
Exports, Imports, and Balance (exhibit 1)
For 2019, the goods and services deficit was $616.8 billion, down $10.9 billion from $627.7 billion in 2018. Exports were $2,499.8 billion, down $1.5 billion from 2018. Imports were $3,116.5 billion, down $12.5 billion from 2018.

The 2019 decrease in the goods and services deficit reflected a decrease in the goods deficit of $21.4 billion, or 2.4 percent, to $866.0 billion and a decrease in the services surplus of $10.4 billion, or 4.0 percent, to $249.2 billion.
As a percentage of U.S. gross domestic product, the goods and services deficit was 2.9 percent in 2019, down from 3.0 percent in 2018.
Exports (exhibits 3, 6, and 7)
Exports of goods decreased $21.3 billion to $1,653.0 billion in 2019.
Exports of goods on a Census basis decreased $20.5 billion.
- Capital goods decreased $15.8 billion.
- Civilian aircraft decreased $12.6 billion.
- Industrial supplies and materials decreased $11.1 billion.Other goods increased $5.1 billion.
- Other petroleum products decreased $7.6 billion.
Net balance of payments adjustments decreased $0.8 billion.
Exports of services increased $19.7 billion to $846.7 billion in 2019.
- Other business services increased $13.7 billion.
- Telecommunications, computer, and information services increased $4.8 billion.
Imports (exhibits 4, 6, and 8)
Imports of goods decreased $42.6 billion to $2,519.0 billion in 2019.
Imports of goods on a Census basis decreased $42.3 billion.
- Industrial supplies and materials decreased $53.6 billion.
- Crude oil decreased $30.3 billion.
- Capital goods decreased $14.4 billion.Other goods increased $11.6 billion.
- Computer accessories decreased $11.6 billion.
- Telecommunications equipment decreased $11.6 billion.
- Civilian aircraft engines increased $4.5 billion.
- Consumer goods increased $7.1 billion.
- Pharmaceutical preparations increased $16.0 billion.
- Gem diamonds decreased $4.1 billion.
Net balance of payments adjustments decreased $0.3 billion.
Imports of services increased $30.2 billion to $597.5 billion in 2019.
- Travel increased $7.8 billion.
- Insurance services increased $7.1 billion.
- Other business services increased $5.6 billion.
Goods by Selected Countries and Areas – Census Basis (exhibits 14 and 14a)
The 2019 figures show surpluses, in billions of dollars, with South and Central America ($53.7), Hong Kong ($26.1), Netherlands ($21.5), Australia ($15.2), Belgium ($14.6), Brazil ($12.2), and United Kingdom ($6.0). Deficits were recorded, in billions of dollars, with China ($345.6), European Union ($177.9), Mexico ($101.8), Japan ($69.0), Germany ($67.2), Ireland ($52.7), Italy ($33.4), Malaysia ($27.4), Canada ($27.0), Switzerland ($26.7), India ($23.3), Taiwan ($23.0), South Korea ($20.6), Thailand ($20.2), France ($19.7), Russia ($16.5), and Indonesia ($12.4).
- The deficit with China decreased $73.9 billion to $345.6 billion in 2019. Exports decreased $13.5 billion to $106.6 billion and imports decreased $87.4 billion to $452.2 billion.
- The surplus with South and Central America increased $11.7 billion to $53.7 billion in 2019. Exports decreased $1.6 billion to $162.6 billion and imports decreased $13.3 billion to $108.9 billion.
- The deficit with Mexico increased $21.1 billion to $101.8 billion in 2019. Exports decreased $9.1 billion to $256.4 billion and imports increased $12.0 billion to $358.1 billion.
-----
Earlier:
2020, January, 31, 11:25:00
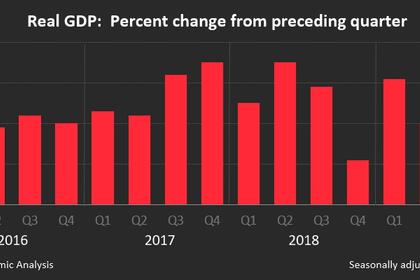
U.S. GDP UP 2.1%
U.S. real gross domestic product (GDP) increased at an annual rate of 2.1 percent in the fourth quarter of 2019
2020, January, 31, 11:20:00
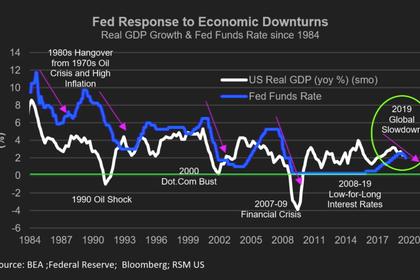
U.S. FEDERAL FUNDS RATE 1.5-1.75%
Consistent with its statutory mandate, the Committee seeks to foster maximum employment and price stability. The Committee decided to maintain the target range for the federal funds rate at 1‑1/2 to 1-3/4 percent.
2020, January, 29, 13:25:00
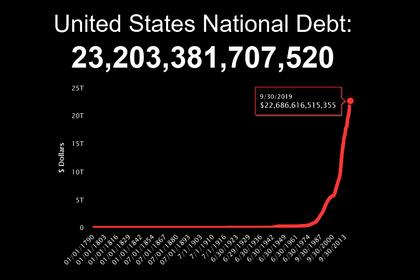
U.S. DEBT WILL RISE TO 98%
The U.S. government will spend $1 trillion more than it collects in 2020 and deficits will reach or exceed that threshold every year for the foreseeable future. As a share of gross domestic product, the deficit will be at least 4.3% every year through 2030.


