2020-02-05 11:05:00


U.S. OIL & GAS PRODUCTION UP
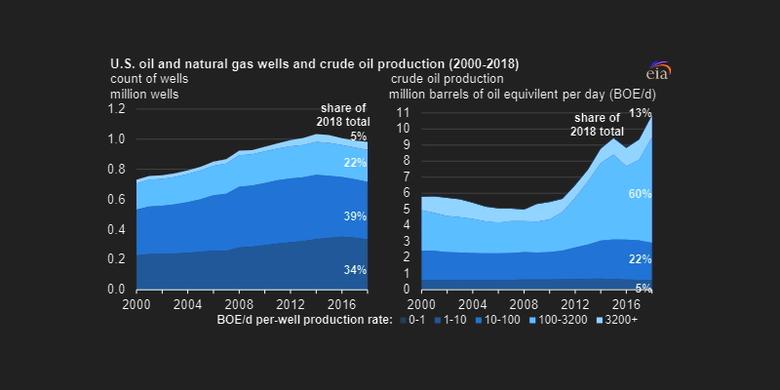
U.S. EIA - In 2018, while production was increasing, the total number of wells producing crude oil and natural gas in the United States fell to 982,000, down from a peak of 1,035,000 wells in 2014. This increase in production, despite the decline in the number of wells, reflects advances in technology and drilling techniques. The U.S. Energy Information Administration (EIA)’s updated U.S. Oil and Natural Gas Wells by Production Rate report shows how daily production rates of individual wells by state contributed to an increase in total crude oil and natural gas production in 2018.
Wells classified as non-horizontal in the report—most of which are vertical wells—have decreased 10% from 935,000 in 2014 to 842,000 in 2018. Horizontal wells are relatively less common, but they are growing as a share of the total; the 99,000 horizontal wells drilled in 2014 accounted for 10% of the total. In 2018, 140,000 horizontal wells accounted for 14% of total wells drilled.
Although horizontal wells are more expensive to drill than vertical wells, they contact more reservoir rock and therefore produce greater volumes. Only 1% of vertical wells produced at least 100 barrels per day of crude oil in 2018, but 32% of horizontal wells produced at least 100 barrels per day. As horizontal wells became more common, production growth continued as the well count fell.

Even with fewer wells, U.S. oil production grew from 8.8 million barrels per day (b/d) in 2014 to 10.8 million b/d in 2018. During that same period, U.S. natural gas production (gross withdrawals) increased from about 78.5 billion cubic feet per day (Bcf/d) to 94.8 Bcf/d. Since 2019, crude oil and natural gas production has continued to grow. In November 2019, crude oil production had increased to about 12.9 million b/d and natural gas production had increased to 116.9 Bcf/d.
In its report, EIA groups wells into 26 production volume brackets, ranging from less than one barrel of oil equivalent per day (BOE/d) to more than 12,800 BOE/d. Most U.S. oil and natural gas production comes from wells producing between 50 BOE/d and 1,600 BOE/d. In 2018, wells within this range accounted for 9% of active wells that produced 66% of crude oil production and 62% of natural gas production.


-----
Earlier:
2020, February, 3, 11:50:00
U.S. GAS PRODUCTION UP 8.3%
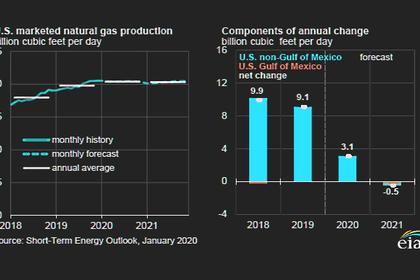
The preliminary level for dry natural gas production in November 2019 was 2,896 billion cubic feet (Bcf), or 96.5 Bcf/d. This level was 7.4 Bcf/d (8.3%) higher than the November 2018 level of 89.2 Bcf/d.
2020, February, 3, 11:10:00
U.S. RIGS DOWN 4 TO 790
U.S. Rig Count is down 4 rigs from last week to 790, Canada Rig Count is up 3 rig from last week at 247
2020, January, 31, 12:25:00
U.S. OIL PRODUCTION FORECAST: 14 MBD
In the AEO2020 Reference case, U.S. crude oil production reaches 14.0 million barrels per day (b/d) by 2022 and remains near this level through 2045 as tight oil development moves into less productive areas and well productivity declines.
2020, January, 24, 13:35:00
U.S. OIL EXPORTS 9 MBD
U.S. petroleum exports hit a new all-time high of 9.0 million barrels per day (mb/d) in the final month of 2019
2020, January, 24, 13:25:00
U.S. OIL PRODUCTION SLOWING
U.S. crude oil production will average 13.3 million barrels per day (b/d) in 2020, a 9% increase from 2019 production levels, and 13.7 million b/d in 2021, a 3% increase from 2020.
2020, January, 22, 12:50:00
U.S. PRODUCTION: OIL + 22 TBD, GAS + 65 MCFD
Crude oil production from the major US onshore regions is forecast to increase 22,000 b/d month-over-month in January from 9,178 to 9,200 thousand barrels/day, gas production to increase 65 million cubic feet/day from 85,920 to 85,985 million cubic feet/day .
2020, January, 15, 12:40:00
U.S. GAS WILL DOWN
U.S. dry gas production will fall to 94.11 billion cubic feet per day (bcfd) in 2021 from a record 94.74 bcfd in 2020. The current all-time high is 92.03 bcfd in 2019.


