2020-02-19 11:30:00
U.S. PRODUCTION: OIL +18 TBD, GAS (-172) MCFD
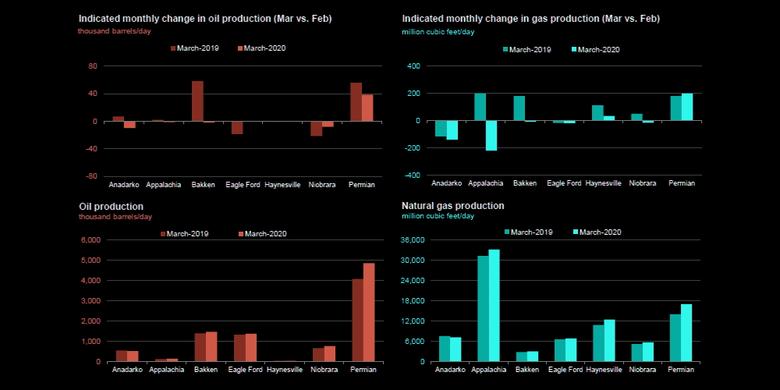
U.S. EIA - Crude oil production from the major US onshore regions is forecast to increase 18,000 b/d month-over-month in February from 9,157 to 9,175 thousand barrels/day, gas production to decrease 172 million cubic feet/day from 85,619 to 85,447 million cubic feet/day .
| Oil production thousand barrels/day | Gas production million cubic feet/day | |||||
|---|---|---|---|---|---|---|
| Region | February 2020 | March 2020 | change | February 2020 | March 2020 | change |
| Anadarko | 536 | 526 | (10) | 7,395 | 7,255 | (140) |
| Appalachia | 146 | 145 | (1) | 33,350 | 33,130 | (220) |
| Bakken | 1,474 | 1,472 | (2) | 3,079 | 3,070 | (9) |
| Eagle Ford | 1,369 | 1,369 | - | 6,878 | 6,859 | (19) |
| Haynesville | 39 | 39 | - | 12,407 | 12,441 | 34 |
| Niobrara | 777 | 769 | (8) | 5,725 | 5,709 | (16) |
| Permian | 4,816 | 4,855 | 39 | 16,785 | 16,983 | 198 |
| Total | 9,157 | 9,175 | 18 | 85,619 | 85,447 | (172) |
| New-well oil production per rig barrels/day | New-well gas production per rig thousand cubic feet/day | |||||
|---|---|---|---|---|---|---|
| Region | February 2020 | March 2020 | change | February 2020 | March 2020 | change |
| Anadarko | 722 | 751 | 29 | 4,365 | 4,481 | 116 |
| Appalachia | 119 | 127 | 8 | 15,060 | 15,250 | 190 |
| Bakken | 1,388 | 1,419 | 31 | 2,022 | 2,064 | 42 |
| Eagle Ford | 1,461 | 1,482 | 21 | 4,927 | 4,937 | 10 |
| Haynesville | 25 | 25 | - | 10,303 | 10,326 | 23 |
| Niobrara | 1,232 | 1,237 | 5 | 4,270 | 4,292 | 22 |
| Permian | 813 | 815 | 2 | 1,566 | 1,571 | 5 |
| Rig-weighted average | 835 | 853 | 18 | 3,858 | 3,845 | (13) |
| Drilled but uncompleted wells (DUC) wells | ||||
|---|---|---|---|---|
| Region | December 2019 | January 2020 | change | |
| Anadarko | 761 | 711 | (50) | |
| Appalachia | 543 | 537 | (6) | |
| Bakken | 814 | 841 | 27 | |
| Eagle Ford | 1,404 | 1,392 | (12) | |
| Haynesville | 237 | 240 | 3 | |
| Niobrara | 467 | 457 | (10) | |
| Permian | 3,490 | 3,504 | 14 | |
| Total | 7,716 | 7,682 | (34) | |
-----
Earlier:
2020, February, 17, 12:00:00
U.S. GAS PRICES: THE LOWEST LEWEL
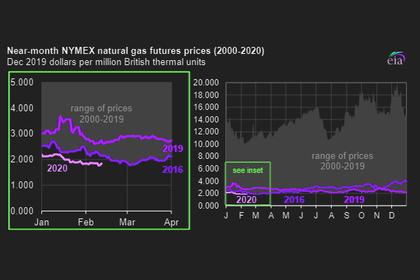
This winter, U.S. natural gas prices have been at their lowest levels in decades.

2020, February, 17, 11:20:00
U.S. RIGS UNCHANGED TO 790 ANEW
U.S. Rig Count is unchanged from last week at 790, Canada Rig Count is down 2 rigs from last week to 255,
2020, February, 5, 11:05:00
U.S. OIL & GAS PRODUCTION UP
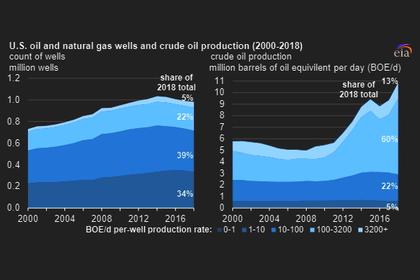
In 2018, while production was increasing, the total number of wells producing crude oil and natural gas in the United States fell to 982,000, down from a peak of 1,035,000 wells in 2014.
2020, February, 3, 11:50:00
U.S. GAS PRODUCTION UP 8.3%
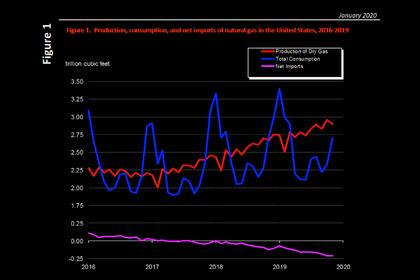
The preliminary level for dry natural gas production in November 2019 was 2,896 billion cubic feet (Bcf), or 96.5 Bcf/d. This level was 7.4 Bcf/d (8.3%) higher than the November 2018 level of 89.2 Bcf/d.
2020, January, 31, 12:25:00
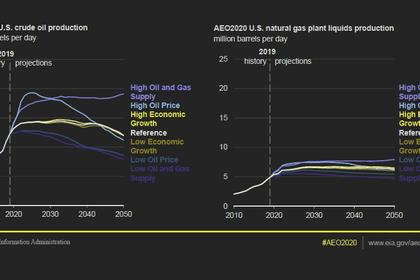
U.S. OIL PRODUCTION FORECAST: 14 MBD
In the AEO2020 Reference case, U.S. crude oil production reaches 14.0 million barrels per day (b/d) by 2022 and remains near this level through 2045 as tight oil development moves into less productive areas and well productivity declines.


