2020-02-17 11:15:00


WHAT ABOUT INFORMATION MANAGEMENT?
Chris Flowers, Principal Solutions Consultant, OpenText
ENERGYCENTRAL - I see a lot of progress from solutions and operational discipline when it comes to data management, and continued focus on how to make that data actionable. But what about the information and document that's still needed to run a business? SOPs, training, capital/ops reporting, projects, contracts, engineering drawings, etc. How is that being stored, cataloged, and managed so that it's available when needed?
-----
This question is posted in the Energy Central's Utility Management Community Group. The communities are a place where professionals in the power industry can share, learn and connect in a collaborative environment. If you can help answer, please follow this link. Your help is greatly appreciated.
-----
Earlier:
2020, February, 14, 12:00:00
FIVE KEY TRENDS IN THE POWER INDUSTRY
The power industry is evolving because it must meet a growing demand for electricity, as the world population continues to increase and developing countries industrialise.
2020, February, 10, 10:10:00
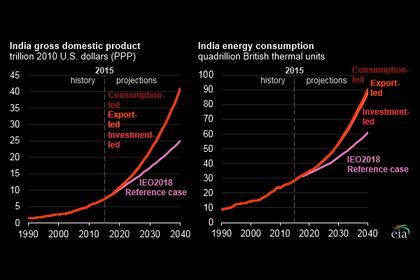
INDIA'S ELECTRICITY UPGRADE
India’s national transmission grid must urgently modernise to increase the rate of renewable energy adoption
2020, February, 7, 10:30:00
EUROPE'S CLEAN ENERGY INVESTMENT $5.4 BLN
"New targeted credit lines will support climate action by companies in Bulgaria, Italy, Romania and Spain, improve access to finance by energy, tourism and education companies in Serbia, help agriculture firms in Romania to expand and encourage circular economy investment in Spain," the EIB said in a statement.

2020, February, 3, 12:10:00
ЭНЕРГЕТИЧЕСКИЙ РЫНОК ЕАЭС
Минэнерго России ведет планомерную работу с профильными ведомствами стран ЕАЭС по линии энергетики, добавил Александр Новак по итогам заседания.
2020, January, 31, 11:45:00
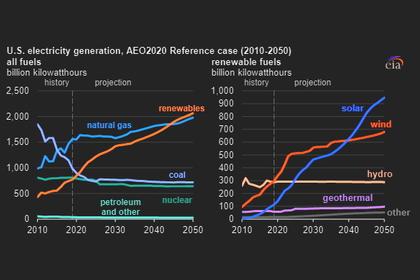
U.S. RENEWABLES WILL UP
U.S. electricity generation from renewable sources such as wind and solar to surpass nuclear and coal by 2021 and to surpass natural gas in 2045.
2020, January, 29, 13:20:00
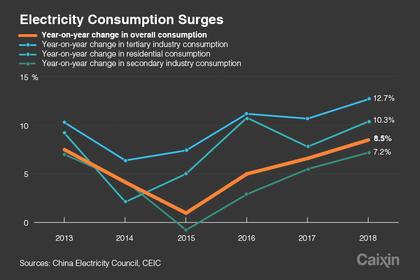
CHINA'S ELECTRICITY CONSUMPTION UP 4.5%
Overall, China's power generation rose by 4.7% in 2019, triggered by nuclear power generation (+18%) and renewable power generation (+5.7% for hydropower, +11% for wind and +25% for solar). CO2-free power generation thus accounted for 32.6% of the country's power mix. Thermal power generation grew at a slower pace (+2.4%, with +1.7% for coal-fired power generation).
2020, January, 24, 13:10:00
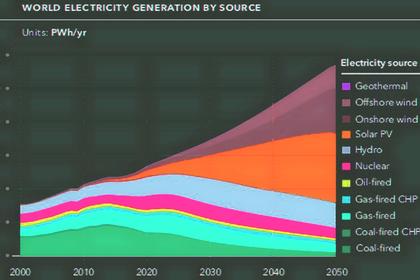
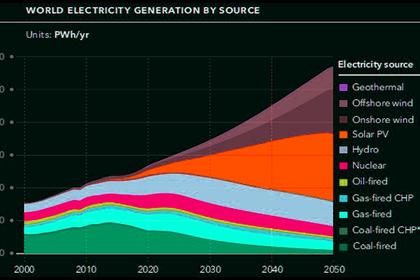
GLOBAL RENEWABLE ELECTRICITY UP 20%
global electric power generation from renewable sources will increase more than 20% throughout the projection period (2018–2050), providing almost half of the world’s electricity generation in 2050. In that same period, global coal-fired generation will decrease 13%, representing only 22% of the generation mix in 2050.


