2020-03-06 11:55:00


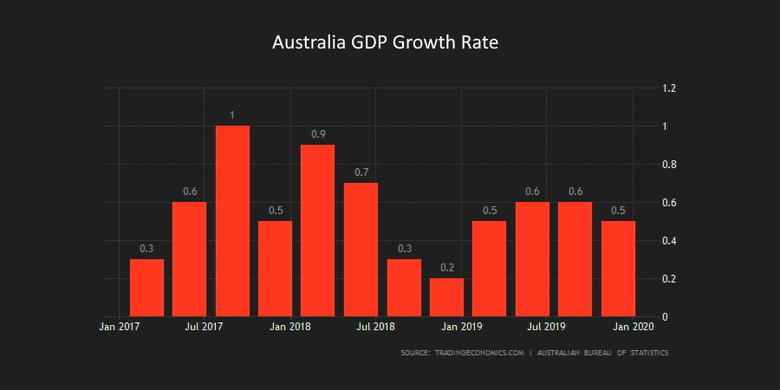
AUSTRALIA'S GDP GROWTH 2.0%
IMF - March 4, 2020 - On February 21, 2020, the Executive Board of the International Monetary Fund (IMF) concluded the Article IV consultation with Australia.
Economic growth has recovered gradually in 2019 from the lows in the second half of 2018, supported by accommodative fiscal and monetary policies. Net exports have also contributed to growth, as Australia has largely avoided global trade disruptions. While employment grew significantly, relatively high unemployment and underemployment rates suggest persistent labor market slack. Headline and underlying inflation dipped below the Reserve Bank of Australia (RBA)’s target range of 2-3 percent. Housing prices have experienced a renewed pickup following a marked price correction during 2017-19.
Australian banks have remained adequately capitalized and profitable, with continued reliance on offshore wholesale funding and considerable loan concentration in residential mortgages constituting underlying vulnerabilities. The capital framework for banks has been further strengthened with a higher capital requirement for domestic systemically important banks from 2024.
A continued gradual economic recovery is expected, subject to downside risks. Growth should continue to recover in 2020, but it will take time for the economy to return to potential and restore inflation to within the target range. Risks to the outlook remain tilted to the downside. External risks include a possible re-escalation of U.S./China trade tensions and a sharp tightening of global financial conditions, along with near-term risks related to the recent coronavirus outbreak. Domestic risks include a further weakening of private consumption if cooling labor markets squeezed household income. Adverse weather conditions, including a worsening of the bushfires, could affect consumption and tourism in affected urban areas and rural agriculture. By contrast, looser financial conditions could re-accelerate house price inflation, boosting private consumption but also adding to medium-term vulnerabilities given high household debt levels.
Executive Directors commended the authorities for the sound macroeconomic management and strong policy frameworks, which have underpinned the resilience of Australia’s economy. Nevertheless, Directors noted that downside risks to the near-term economic outlook remain elevated and have recently increased amid the coronavirus outbreak. Directors expressed sympathy for the devastating effects of the droughts and bushfires.
Directors highlighted that the near-term macroeconomic policy mix should remain accommodative. They welcomed the expansionary fiscal policy stance in FY2019/20, driven by tax cuts and additional infrastructure spending. Considering Australia’s output gap and substantial fiscal space, Directors generally recommended that a contractionary fiscal stance expected in FY2020/21 should be avoided, including by maintaining state-level infrastructure spending at current levels. However, some Directors underscored the need to preserve fiscal buffers to guard against potential downside risks.
Directors supported the current monetary policy stance. They highlighted that maintaining data-dependent accommodative monetary policy will be helpful to support the recovery of domestic demand. Directors agreed that, should downside risks materialize, the authorities should be ready for a coordinated response, including using fiscal stimulus jointly with both conventional and unconventional monetary policy measures.
Directors agreed that the current macroprudential policy stance remains appropriate. Given the risk of renewed overheating of housing markets in a low-interest-rate environment, they encouraged the authorities to continue improving the readiness of their macroprudential toolkit.
Directors welcomed that Australian banks remain adequately capitalized and profitable. They supported the authorities’ plans to further enhance banks’ loss-absorbing capacity and implement the recommendations made by the Hayne Royal Commission. Directors emphasized that reform priorities should include encouraging a further lengthening of the maturity of banks’ wholesale funding, implementing the APRA Capability Review’s recommendations, reinforcing financial crisis management arrangements as highlighted in the 2018 FSAP, and strengthening the AML/CFT regime.
Directors underscored that housing supply reforms remain critical for restoring affordability. They highlighted the importance of more efficient long-term planning, zoning, and local government reform, along with a focus on infrastructure development.
Directors encouraged the authorities to step up structural reforms to support strong and inclusive growth. Reform efforts should focus on strengthening business investment, supporting SMEs’ access to finance, pursuing product market deregulation, and introducing well-targeted tax incentives. Further increasing infrastructure spending, while focusing on the quality of investment, would also help boost potential growth. Directors recommended steps to promote innovation, increase full-time female employment, and reduce youth underemployment. They welcomed the authorities’ efforts to support cooperation in international trade and investment. Directors generally encouraged the authorities to develop an ambitious, national, integrated approach to energy policy and climate change taking into account domestic political economy considerations. This would help reduce policy uncertainty and catalyze business investment in Australia.
|
(Annual percent change, unless otherwise indicated) |
|||||||||||
|
2015 |
2016 |
2017 |
2018 |
2019 |
2020 |
2021 |
2022 |
2023 |
2024 |
2025 |
|
|
Projections |
|||||||||||
|
NATIONAL ACCOUNTS |
|||||||||||
|
Real GDP |
2.3 |
2.8 |
2.5 |
2.7 |
1.8 |
2.0 |
2.4 |
2.5 |
2.6 |
2.6 |
2.6 |
|
Domestic demand |
1.0 |
1.8 |
3.0 |
2.9 |
1.1 |
1.7 |
2.4 |
2.5 |
2.5 |
2.5 |
2.5 |
|
Private consumption |
2.4 |
2.7 |
2.5 |
2.7 |
1.4 |
1.8 |
2.7 |
2.7 |
2.7 |
2.6 |
2.6 |
|
Public consumption |
4.0 |
5.1 |
3.9 |
4.0 |
5.2 |
2.9 |
2.0 |
2.0 |
2.0 |
2.2 |
2.2 |
|
Investment |
-4.0 |
-2.3 |
3.5 |
2.4 |
-2.8 |
0.3 |
2.0 |
2.6 |
2.8 |
2.8 |
2.7 |
|
Public |
-1.5 |
14.0 |
10.4 |
2.1 |
1.5 |
3.4 |
1.8 |
1.4 |
1.2 |
1.2 |
1.2 |
|
Private business |
-9.9 |
-11.8 |
4.0 |
3.2 |
-0.7 |
1.0 |
2.6 |
3.4 |
3.8 |
3.8 |
3.6 |
|
Dwelling |
9.1 |
8.0 |
-2.2 |
4.7 |
-6.9 |
-5.3 |
1.0 |
2.3 |
2.4 |
2.5 |
2.0 |
|
Net exports (contribution to growth, percentage points) |
0.9 |
1.4 |
-0.8 |
0.2 |
1.0 |
0.0 |
0.0 |
0.0 |
0.1 |
0.1 |
0.1 |
|
Gross domestic income |
-0.2 |
2.8 |
4.9 |
3.1 |
3.4 |
2.3 |
1.3 |
1.3 |
2.0 |
2.3 |
2.4 |
|
Investment (percent of GDP) 1/ |
25.9 |
24.6 |
24.2 |
24.2 |
22.5 |
22.3 |
22.4 |
22.7 |
22.8 |
22.8 |
22.8 |
|
Public |
4.4 |
4.8 |
5.1 |
5.1 |
5.0 |
5.0 |
5.0 |
5.0 |
5.0 |
4.9 |
4.8 |
|
Private |
21.4 |
19.7 |
19.1 |
19.0 |
17.7 |
17.3 |
17.4 |
17.6 |
17.8 |
17.9 |
18.0 |
|
Mining investment |
5.4 |
3.9 |
3.1 |
2.7 |
2.5 |
2.7 |
2.7 |
2.7 |
2.7 |
2.7 |
2.7 |
|
Non-mining investment |
16.0 |
15.8 |
16.0 |
16.3 |
15.1 |
14.7 |
14.7 |
14.9 |
15.1 |
15.2 |
15.3 |
|
Savings (gross, percent of GDP) |
21.6 |
20.8 |
22.0 |
21.8 |
22.4 |
21.9 |
21.1 |
20.4 |
20.2 |
20.1 |
20.0 |
|
Potential output |
2.6 |
2.5 |
2.4 |
2.3 |
2.2 |
2.2 |
2.2 |
2.3 |
2.4 |
2.5 |
2.5 |
|
Output gap (percent of potential) |
-1.2 |
-0.9 |
-0.8 |
-0.4 |
-0.8 |
-1.0 |
-0.8 |
-0.6 |
-0.4 |
-0.2 |
0.0 |
|
LABOR MARKET |
|||||||||||
|
Employment |
2.0 |
1.8 |
2.3 |
2.7 |
2.3 |
2.0 |
1.8 |
1.8 |
1.8 |
1.8 |
1.7 |
|
Unemployment (percent of labor force) |
6.1 |
5.7 |
5.6 |
5.3 |
5.2 |
5.2 |
5.2 |
5.1 |
5.0 |
4.9 |
4.8 |
|
Wages (nominal percent change) |
2.1 |
1.9 |
1.8 |
2.1 |
2.2 |
2.2 |
2.3 |
2.6 |
3.0 |
3.3 |
3.3 |
|
PRICES |
|||||||||||
|
Terms of trade index (goods, avg) |
88 |
87 |
100 |
103 |
112 |
110 |
105 |
100 |
97 |
95 |
94 |
|
% change |
-12.4 |
-0.4 |
14.5 |
3.1 |
8.6 |
-2.0 |
-4.2 |
-5.2 |
-3.1 |
-1.5 |
-1.1 |
|
Iron ore prices (index) |
44 |
46 |
56 |
55 |
74 |
69 |
61 |
56 |
54 |
54 |
54 |
|
Coal prices (index) |
67 |
75 |
101 |
121 |
88 |
83 |
86 |
88 |
88 |
88 |
88 |
|
LNG prices (index) |
61 |
42 |
41 |
55 |
31 |
28 |
35 |
37 |
37 |
37 |
37 |
|
Crude prices (Brent; index) |
48 |
40 |
50 |
65 |
59 |
60 |
55 |
53 |
52 |
52 |
53 |
|
Consumer prices (avg) |
1.5 |
1.3 |
2.0 |
1.9 |
1.6 |
1.9 |
1.9 |
2.1 |
2.3 |
2.5 |
2.5 |
|
Core consumer prices (avg) |
2.3 |
1.7 |
1.6 |
1.6 |
1.6 |
1.8 |
1.9 |
2.1 |
2.3 |
2.5 |
2.5 |
|
GDP deflator (avg) |
-0.7 |
1.0 |
3.7 |
2.2 |
3.3 |
1.2 |
0.8 |
1.3 |
2.0 |
2.2 |
2.3 |
|
FINANCIAL |
|||||||||||
|
Reserve Bank of Australia cash rate (percent, avg) |
2.1 |
1.7 |
1.5 |
1.5 |
1.2 |
0.4 |
0.3 |
0.5 |
1.0 |
1.5 |
2.0 |
|
10-year treasury bond yield (percent, avg) |
2.7 |
2.3 |
2.6 |
2.6 |
1.4 |
0.5 |
0.5 |
0.9 |
1.4 |
1.9 |
2.4 |
|
Mortgage lending rate (percent, avg) |
5.6 |
5.4 |
5.2 |
5.3 |
4.8 |
4.3 |
4.3 |
4.8 |
5.3 |
5.8 |
6.3 |
|
MACRO-FINANCIAL |
|||||||||||
|
Credit to the private sector |
6.8 |
5.6 |
5.2 |
4.7 |
2.3 |
3.4 |
4.3 |
4.5 |
4.8 |
5.0 |
5.0 |
|
House price index |
131 |
141 |
148 |
140 |
144 |
149 |
154 |
159 |
163 |
168 |
173 |
|
% change |
8.7 |
7.7 |
5.0 |
-5.1 |
2.5 |
3.7 |
3.4 |
3.0 |
3.0 |
3.0 |
3.0 |
|
House price-to-income, capital cities (ratio) |
4.5 |
4.7 |
4.7 |
4.4 |
4.3 |
4.3 |
4.3 |
4.2 |
4.2 |
4.1 |
3.9 |
|
Interest payments (percent of disposable income) |
8.8 |
8.6 |
8.9 |
9.0 |
7.4 |
6.4 |
6.3 |
7.1 |
7.8 |
8.5 |
8.5 |
|
Household savings (percent of disposable income) |
6.4 |
5.0 |
4.1 |
2.9 |
3.4 |
4.3 |
3.6 |
3.2 |
3.2 |
3.2 |
3.3 |
|
Household debt (percent of disposable income) 2/ |
173 |
180 |
187 |
187 |
185 |
183 |
181 |
178 |
175 |
172 |
170 |
|
Business credit (percent of GDP) |
51 |
51 |
50 |
50 |
49 |
49 |
49 |
50 |
50 |
50 |
51 |
|
GENERAL GOVERNMENT (percent of GDP) 3/ |
|||||||||||
|
Revenue |
34.2 |
34.8 |
34.6 |
35.5 |
36.0 |
35.8 |
36.0 |
35.9 |
35.3 |
35.3 |
35.3 |
|
Expenditure |
37.2 |
37.5 |
36.9 |
36.6 |
36.8 |
36.9 |
36.6 |
36.1 |
35.4 |
35.2 |
35.1 |
|
Net lending/borrowing |
-2.9 |
-2.7 |
-2.3 |
-1.1 |
-0.8 |
-1.0 |
-0.6 |
-0.1 |
0.0 |
0.2 |
0.3 |
|
Commonwealth only |
-2.6 |
-2.3 |
-1.9 |
-0.3 |
0.1 |
0.2 |
0.2 |
0.4 |
0.1 |
0.3 |
0.4 |
|
Operating balance |
-1.7 |
-1.4 |
-0.8 |
0.5 |
1.0 |
0.9 |
1.4 |
1.7 |
1.6 |
1.7 |
1.8 |
|
Cyclically adjusted balance |
-2.7 |
-2.4 |
-2.2 |
-1.0 |
-0.7 |
-0.9 |
-0.4 |
0.0 |
0.1 |
0.2 |
0.3 |
|
Gross debt |
35.8 |
39.5 |
41.0 |
41.2 |
41.7 |
43.0 |
42.7 |
43.0 |
41.7 |
40.2 |
38.7 |
|
Net debt |
16.4 |
19.0 |
18.5 |
19.1 |
19.8 |
20.9 |
20.8 |
20.1 |
19.1 |
17.9 |
16.7 |
|
Net worth |
50.9 |
46.0 |
50.1 |
49.5 |
34.9 |
42.7 |
44.4 |
46.4 |
47.5 |
47.1 |
46.6 |
|
BALANCE OF PAYMENTS |
|||||||||||
|
Current account (percent of GDP) |
-4.6 |
-3.3 |
-2.6 |
-2.1 |
0.4 |
-0.4 |
-1.3 |
-2.2 |
-2.6 |
-2.8 |
-2.8 |
|
Export volume |
6.5 |
6.9 |
3.4 |
5.1 |
3.5 |
1.7 |
2.1 |
2.1 |
2.3 |
2.3 |
2.5 |
|
Import volume |
2.0 |
0.1 |
7.8 |
4.1 |
-1.1 |
1.6 |
2.4 |
2.1 |
2.0 |
2.0 |
2.0 |
|
Net international investment position (percent of GDP) |
-56 |
-57 |
-54 |
-54 |
-49 |
-48 |
-48 |
-48 |
-49 |
-49 |
-50 |
|
Gross official reserves (bn A$) |
63 |
74 |
85 |
76 |
… |
… |
… |
… |
… |
… |
… |
|
MEMORANDUM ITEMS |
|||||||||||
|
Nominal GDP (bn A$) |
1,641 |
1,703 |
1,808 |
1,899 |
1,995 |
2,060 |
2,127 |
2,209 |
2,314 |
2,427 |
2,547 |
|
Percent change |
1.6 |
3.8 |
6.2 |
5.0 |
5.1 |
3.3 |
3.3 |
3.9 |
4.7 |
4.9 |
5.0 |
|
Real GDP per capita (% change) |
0.8 |
1.1 |
0.8 |
1.1 |
0.2 |
0.5 |
0.9 |
0.9 |
1.1 |
1.1 |
1.1 |
|
Population (million) |
24.0 |
24.4 |
24.8 |
25.2 |
25.6 |
26.0 |
26.4 |
26.8 |
27.2 |
27.6 |
28.0 |
|
Nominal effective exchange rate |
90 |
91 |
94 |
90 |
… |
… |
… |
… |
… |
… |
… |
|
Real effective exchange rate |
90 |
91 |
94 |
90 |
… |
… |
… |
… |
… |
… |
… |
|
Sources: Authorities’ data; IMF World Economic Outlook database; and IMF staff estimates and projections. |
|||||||||||
|
1/ Includes changes in inventories. |
|||||||||||
|
2. Reflects the national accounts measure of household debt, including to the financial sector, state and federal governments and foreign overseas banks and governments. It also includes other accounts payable to these sectors and a range of other smaller entities including pensions funds. |
|||||||||||
|
3/ Fiscal year ending June |
|||||||||||
-----
Earlier:
2020, March, 4, 09:05:00
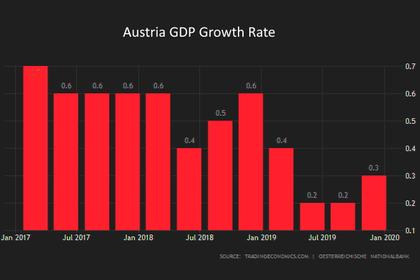
AUSTRIA'S GDP GROWTH 1.25%
Expected Austria's GDP to increase around 1¼ percent this year, mainly supported again by domestic demand.
2020, February, 21, 11:40:00
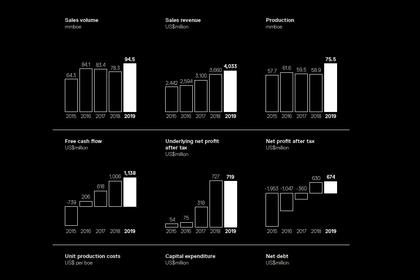
AUSTRALIA'S SANTOS NET PROFIT $674 MLN
Santos has delivered strong financial results with EBITDAX1 up 14% to a record US$2.5 billion and free cash flow1 up 13% to over US$1.1 billion. Reported net profitafter tax increased by 7% to US$674 million.


