2020-03-02 12:45:00


U.S. GAS PRODUCTION UP 8.2%
U.S. EIA - February 28, 2020 - Natural Gas Monthly
February 2020
Data for December 2019
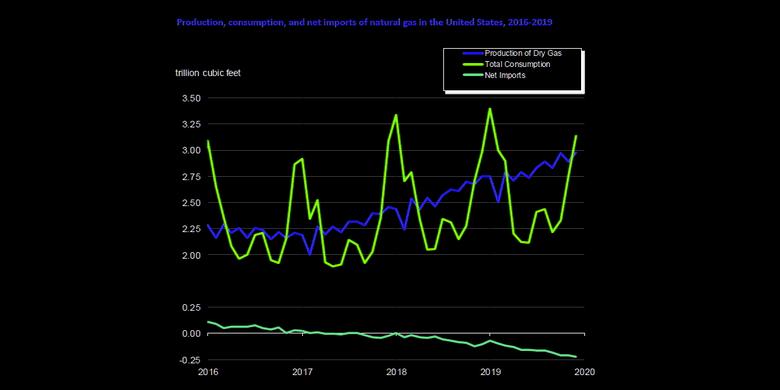
- In December 2019, for the 32nd consecutive month, dry natural gas production increased year to year for the month. The preliminary level for dry natural gas production in December 2019 was 2,977 billion cubic feet (Bcf), or 96.0 Bcf/d. This level was 7.3 Bcf/d (8.2%) higher than the December 2018 level of 88.7 Bcf/d. The average daily rate of dry production was the highest for the month since EIA began tracking monthly dry production in 1997.
- The estimated natural gas consumption in December 2019 was 3,139 Bcf, or 101.3 Bcf/d. This level was 4.7 Bcf/d (4.9%) higher than the 96.5 Bcf/d consumed in December 2018. Natural gas consumption for December was the highest for the month since 2001, when EIA began using the current definitions for consuming sectors.
- Year-over-year total consumption of dry natural gas in December 2019 decreased in two of the four consuming sectors and increased in the other two. Deliveries of natural gas by consuming sector in December 2019 were:
- Residential deliveries: 751 Bcf for the month, or 24.2 Bcf/d
• Down 1.8% compared with 24.7 Bcf/d in December 2018. Residential deliveries were the lowest for the month since 2015. - Commercial deliveries: 456 Bcf for the month, or 14.7 Bcf/d • Down 0.7% compared with 14.8 Bcf/d in December 2018. Commercial deliveries were the lowest for the month since 2015.
- Industrial deliveries: 776 Bcf for the month, or 25.0 Bcf/d • Up 1.6% compared with 24.6 Bcf/d in December 2018. Industrial deliveries were the highest for the month since EIA began using the current definitions for consuming sectors in 2001.
- Electric power deliveries: 897 Bcf for the month, or 28.9 Bcf/d • Up 17.7% compared with 24.6 Bcf/d in December 2018. Electric power deliveries were the highest for the month since EIA began using the current definitions for consuming sectors in 2001.
- Residential deliveries: 751 Bcf for the month, or 24.2 Bcf/d
- Net natural gas imports (imports minus exports) were -225 Bcf, or -7.3 Bcf/d, in December 2019, making the United States a net exporter. Natural gas imports and exports in December 2019 were:
- Total imports: 256 Bcf for the month, or 8.25 Bcf/d
• Down 0.5% compared with 8.30 Bcf/d in December 2018. - Total exports: 481 Bcf for the month, or 15.5 Bcf/d • Up 32.5% compared with 11.7 Bcf/d in December 2018. Natural gas exports were the highest for any month since EIA began tracking monthly exports in 1973. Liquefied natural gas (LNG) continues to drive the year-on-year increase in exports. LNG exports in December 2019 were 78.9% higher than in December 2018. In December 2019, the United States exported 7.1 Bcf/d of LNG to 24 countries. LNG exports were the highest for any month since EIA began tracking them in 1997.
- Total imports: 256 Bcf for the month, or 8.25 Bcf/d
- The February 2020 Natural Gas Monthly includes revisions to November 2019 data for natural gas deliveries to residential, commercial, and industrial consumers:
- The revisions increase U.S. consumption of natural gas in November 2019 by 55 billion cubic feet (Bcf) and decrease in absolute terms the November 2019 balancing item to ‐78 Bcf.
- EIA underreported November 2019 natural gas consumption by 2% because of a processing error related to reported volumes of natural gas send-out. See “Estimation Procedures” in Appendix C for additional information.
- These changes are reflected in NGM Tables 1, 2, 14, 15, 16, and 18, and the revised data are designated with an R.
-----
Earlier:

2020, February, 19, 11:40:00
U.S. ANNOYED: NORD STREAM 2
While Gazprom has said it’s looking at options to complete the pipeline, it hasn’t given any details on where it will find the ship to do the work. One of the pipeline’s financial backers, Austrian gas and oil company OMV AG, has predicted that the Russians will follow through.
2020, February, 19, 11:30:00
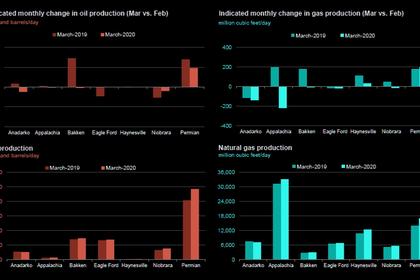
U.S. PRODUCTION: OIL +18 TBD, GAS (-172) MCFD
Crude oil production from the major US onshore regions is forecast to increase 18,000 b/d month-over-month in February from 9,157 to 9,175 thousand barrels/day, gas production to decrease 172 million cubic feet/day from 85,619 to 85,447 million cubic feet/day .
2020, February, 17, 12:00:00
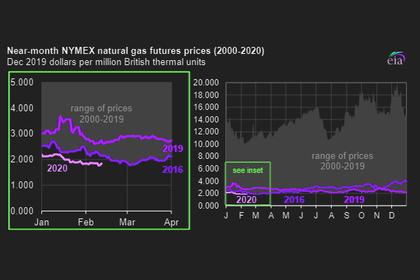
U.S. GAS PRICES: THE LOWEST LEWEL
This winter, U.S. natural gas prices have been at their lowest levels in decades.
2020, February, 10, 10:30:00
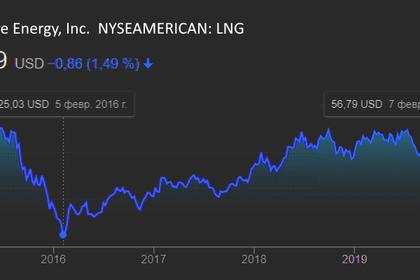
U.S. LNG COMPANIES DOWN
U.S. gas producers are counting on LNG exports to absorb record production from the shale boom. Those exports jumped 68% to a record 5.0 billion cubic feet per day in 2019 after soaring 53% in 2018.


