2020-03-02 12:40:00


U.S. WIND POWER UP
By DW Keefer Journalist Independent Journalist
ENERGYCENTRAL - Wind Generation Surpassed Hydro in 2019 for the First Time
In 2019, U.S. annual wind generation exceeded hydroelectric generation for the first time, according to the U.S. Energy Information Administration (EIA).
Wind now ranks as the top renewable source of electricity generation in the country, a position previously held by hydroelectricity.
EIA said that annual wind generation totaled 300 million megawatthours (MWh) in 2019. That exceeded hydroelectric generation by 26 million MWh.
Wind generation has increased during the past decade, in part, because the federal Production Tax Credit (PTC), which drove wind capacity additions, was extended. Annual hydroelectric generation has fluctuated between 250 million MWh and 320 million MWh in the past decade, reflecting a stable capacity base and variable annual precipitation.
Annual changes in hydroelectric generation are primarily the result of variations in annual precipitation patterns and water runoff. Although weather patterns also affect wind generation in different regions, EIA said that capacity growth has been the main driver of annual changes in wind generation.
Both hydroelectric and wind generation follow seasonal patterns. Hydroelectric generation is typically greatest in the spring when precipitation and melting snowpack increase water runoff. Seasonal patterns in wind generation vary across the country, but wind generation is usually greatest in the spring and fall.
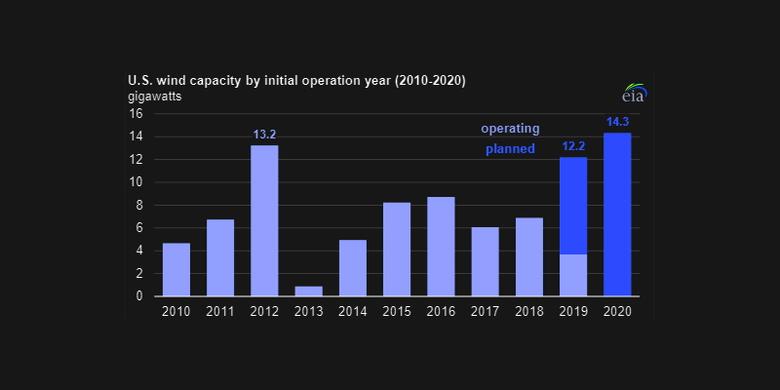
Wind capacity additions tend to come online during the fourth quarter of the year, most likely because of tax benefits, EIA said. Wind capacity additions totaled 10 gigawatts in 2019 (3.8 GW installed in the fourth quarter). That made 2019 the second-largest year for wind capacity additions, second only to 2012.
As of the end of 2019, the United States had 103 GW of wind capacity, nearly all of which (77%) was installed in the past decade. The United States has 80 GW of hydroelectric capacity, most of which has been operating for several decades. Roughly 2 GW of hydroelectric capacity has been added in the past decade, and some of those additions involved converting previously nonpowered dams.
Although total installed wind capacity surpassed total installed hydroelectric capacity in 2016, it wasn’t until 2019 that wind generation surpassed hydroelectric generation, EIA said.
The average annual capacity factors for the hydroelectric fleet between 2009 and 2019 ranged from 35% to 43%. The average annual capacity factors for the U.S. wind fleet were lower, ranging from 28% to 35%.
Capacity factors are the ratio of the electrical energy produced by a generating unit for a specified period of time to the electrical energy that could have been produced at continuous full power operation during the same period.
-----
This thought leadership article was originally shared with Energy Central's Generation Professionals Group. The communities are a place where professionals in the power industry can share, learn and connect in a collaborative environment. Join the Generation Professionals Community today and learn from others who work in the industry.
-----


