GLOBAL LNG CHALLENGES

PE - LNG trade has been driven more by supply than demand throughout most of its history. Producers output as much as they can and the market somehow balances, as any 'surplus' cargoes find a home in a market of last resort. 2020 may be the year when that assumption topples.
After breaking records in 2019–with output and investment scaling new heights–the industry faces an unprecedented combination of factors that look virtually certain to force some exporters to shut in production, or buyers with tolling contracts to cancel cargoes for which the liquefaction fee must still be paid. Except for who bears the pain, both amount to the same thing.
The latest state-of the-industry report from importers' group GIIGNL documents impressive progress during 2019. Output jumped by the largest increment ever, 40.9mn t, and grew by the fastest annual rate since 2010, 13pc. Production reached 355mn t, double what it was a decade ago.
Six large-scale projects reached FID, with an all-time record high combined capacity of 71mn t/yr: Calcasieu Pass, Golden Pass and Sabine Pass Train 6 for over 30mn t/yr in the US; Arctic LNG 2 adding almost 20mn t/yr in Russia; and in sub-Saharan Africa, Mozambique LNG and Nigeria LNG train 7 contributing more than 20mn t/yr.
Spot growth
Continuing a steep climb that began in 2016, spot and short-term trades–defined as contracts with terms of four years or less–grew by 19.7 Mt to reach 119mn t, a one-fifth increase, to just over one-third of the entire market (see Figure 1).
More significantly, this growth was driven primarily by what GIIGNL calls 'true' spot trading, defined as contracts for which delivery occurs 90 days or less after the transaction. It rose from 79mn t in 2018 to 95mn t in 2019.
Given the complexities of booking shipping and regasification slots at short notice, and ensuring that cargoes meet quality specs, all within a three-month window, the spot growth highlights the increasing sophistication of the traded LNG market.
On the supply side, 2019's record growth may not be repeated, but the so-called 'wave' of new volumes is only going to diminish, not disappear entirely. According to the latest short-term LNG outlook from consultancy Wood Mackenzie, another 25mn t can be expected in 2020, with more to come in 2021 and the growth to slow to a trickle only in 2022 (see Figure 2).
The big question is where all this LNG will go, given that the industry was already managing oversupply before Covid-19 emerged. "In the near-term, the disruptive impact of the Covid-19 crisis in the economies of the importing countries will exert downward pressure on LNG demand in an already oversupplied market," predicts GIIGNL president Jean-Marie Dauger.
In 2019, Europe provided the answer. As demand growth in Asia Pacific and other regional markets faltered, Europe—LNG's demand 'sink' due to its liquid, fully liberalised markets and extensive import and storage infrastructure—soaked up 90pc of LNG supply growth last year. Its imports rose by 37 Mt, or 76pc, reaching 86mn t.
"In Europe," says Dauger, "the absorption of surplus volumes was enabled by a combination of lower pipeline imports, declining domestic production, increased storage and additional gas-fired power generation."
But much of the heavy lifting was done by storage injections and European gas inventories are now at record levels. Can a storage-heavy Europe continue to provide a sink market, or can we expect demand to pick up elsewhere to the extent that anticipated new 2020 supply can be absorbed?
Forecast challenges
The uncertainties generated by the Covid-19 pandemic are such that nobody really knows. Even those organisations brave enough to make forecasts are stressing the uncertainties inherent in their outlooks.
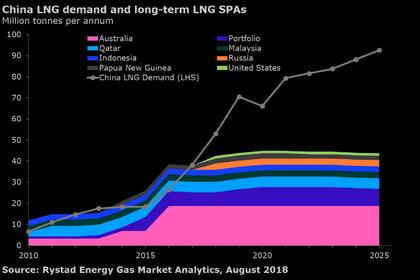
China, whose spectacular gas demand growth between 2015 and 2018 helped to delay the long-predicted supply glut that finally emerged in the first half of 2019, is a case in point. Sublime China Information, a Chinese commodity data and analysis provider, forecasts that the pandemic will erode 2020 Chinese gas demand by 10bn m³ compared to previous expectation–not much in a 330bn m³/yr market. Wood Mackenzie forecasts a 6-14bn m³ reduction, the midpoint of which chimes with SCI's forecast.
Both see Chinese LNG demand rising this year, from c.61mn t last year to 64-66mn t in 2020. In contrast, commodity intelligence firm Icis expects Chinese LNG demand to fall by 5.2pc this year to 58mn t.
Icis also sees continuing declines in Japanese (-1.1pc) and South Korean (-4.7pc) imports. But these would be relatively smaller drops than 6.8pc and 8.7pc respective drops in 2019.
Imports into new markets – defined as countries that have begun importing since 2008 – jumped significantly last year after an atypical fall in 2018, but the volumes involved are relatively small. In total, these 23 countries imported 51.2mn t last year, up from 41.6mn t in 2018. But even the fastest growing of these markets, e.g. Pakistan and Bangladesh, face infrastructure constraints to significant further near-term growth.
India's LNG imports have risen by c.50pc over the past five years, but it also faces infrastructure constraints and coronavirus-related demand challenges.
But, despite Covid-19 risk and low oil prices that could impact LNG's ability to displace fuel oil, some forecasters continue to expect available demand to absorb a supply increase. Japan's Institute of Energy Economics (IEEJ), in late March foresaw 2020 global LNG demand reaching 362mn t if the pandemic is stabilised quickly, or 349mn t if is protracted. The lower figure is still only 6mn t below 2019 requirements.
Wood Mackenzie factors in 0.5bn ft³/d of US liquefaction capacity underutilisation this summer to balance the market. But it still expects LNG supply to reach 388mn t this year.
Spotlight on Europe
Within this, it assumes Europe will import an additional 8mn t, despite its storage overhang and its own lockdown-related demand issues. Yet more switching to gas-fired power generation is cited as the driver, even though other analysts see a large proportion of that demand swing already exhausted, at least in northwest Europe.
Assuming enough coal-to-gas switching capacity is still available to create demand for yet more LNG imports, European gas prices will need to be low enough for the rest of 2020 and into 2021 to outcompete coal. This will be ever more challenging as depressed European industrial output will pull down the CO2 prices that assist gas.
There is also, of course, a feedback loop. Using more gas and less coal pushes down both coal and, because of less emissions, CO2 prices. So gas then needs to fall further to stop coal coming back into the money—and repeat in an ever-lower spiral.
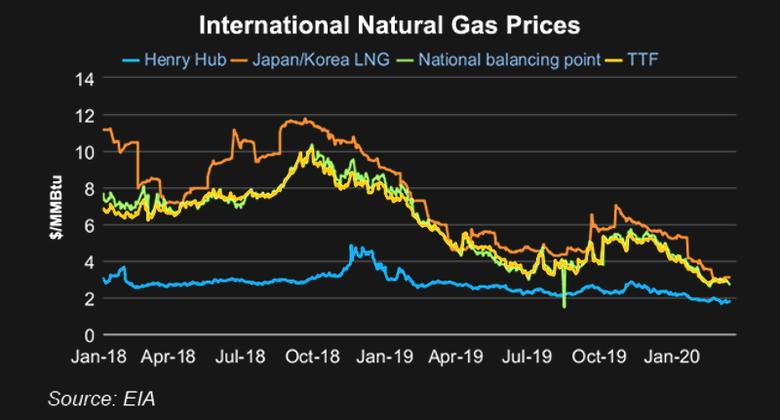
European prices will probably need to be lower than, or at least on a par with, US Henry Hub (HH) prices, especially as ultra-low oil prices will restrict US associated gas production, supporting HH prices. Asian JKM prices are only above Europe by around the marginal shipping costs, so they too will come under pressure.
US under pressure
In the low-rice environment, the disaggregation of US liquefaction from supply—meaning marginal costs tend significantly higher than integrated projects with supply costs already sunk into capex spend—face a challenge.
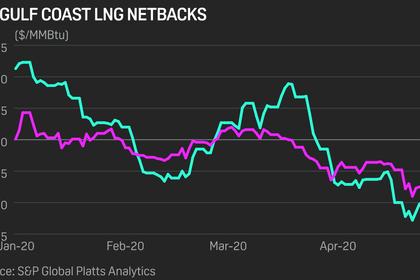
While offtakers must still pay the liquefaction costs to which they have agreed in their tolling or other contractual arrangement, not taking the LNG will save on both gas procurement and shipping costs. So the question may not be whether some US LNG export capacity will be shut in over coming months–but rather how much and for how long.
-----
Earlier:


