2020-04-01 12:35:00


U.S. GAS PRODUCTION UP 7%
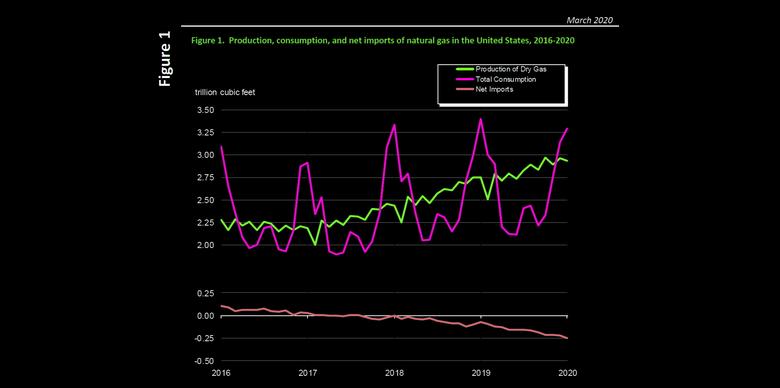
U.S. EIA - March 31, 2020 - Natural Gas Monthly March 2020
· In January 2020, for the 33rd consecutive month, dry natural gas production increased year to year for the month. The preliminary level for dry natural gas production in January 2020 was 2,930 billion cubic feet (Bcf), or 94.5 Bcf/d. This level was 5.9 Bcf/d (6.7%) higher than the January 2019 level of 88.6 Bcf/d. The average daily rate of dry production was the highest for the month since EIA began tracking monthly dry production in 1997.
· Estimated natural gas consumption in January 2020 was 3,288 Bcf, or 106.1 Bcf/d. This level was 3.6 Bcf/d (3.3%) lower than the 109.7 Bcf/d consumed in January 2019 and was the first year-to-year decrease of natural gas consumption since April 2019.
· Year-over-year total consumption of dry natural gas in January 2020 decreased in three of the four consuming sectors. Deliveries of natural gas by consuming sector in January 2020 were
o Residential deliveries: 818 Bcf for the month, or 26.4 Bcf/d
§ Down 14.1% compared with 30.7 Bcf/d in January 2019. Residential deliveries were the lowest for the month since 2012.
o Commercial deliveries: 492 Bcf for the month, or 15.9 Bcf/d
§ Down 11.7% compared with 18.0 Bcf/d in January 2019. Commercial deliveries were the lowest for the month since 2017.
o Industrial deliveries: 787 Bcf for the month, or 25.4 Bcf/d
§ Down 1.3% compared with 25.7 Bcf/d in January 2019. Industrial deliveries were the second highest for the month since EIA began using the current definitions for consuming sectors in 2001.
o Electric power deliveries: 930 Bcf for the month, or 30.0 Bcf/d
§ Up 10.6% compared with 27.1 Bcf/d in January 2019. Electric power deliveries were the highest for the month since EIA began using the current definitions for consuming sectors in 2001.
· Net natural gas imports (imports minus exports) were -251 Bcf, or -8.1 Bcf/d, in January 2020, making the United States a net exporter. Natural gas imports and exports in January 2020 were
o Total imports: 256 Bcf for the month, or 8.3 Bcf/d
§ Down 12.0% compared with 9.4 Bcf/d in January 2019. Natural gas imports were the lowest for the month since 1995.
o Total exports: 507 Bcf for the month, or 16.4 Bcf/d
§ Up 38.9% compared with 11.8 Bcf/d in January 2019. Natural gas exports were the highest for any month since EIA began tracking monthly exports in 1973. Liquefied natural gas (LNG) continues to drive the year-on-year increase in exports. LNG exports in January 2020 were 96.9% higher than in January 2019. In January 2020, the United States exported 8.1 Bcf/d of LNG to 25 countries. LNG exports were the highest for any month since EIA began tracking them in 1997.
-----


