2020-04-14 14:50:00
U.S. PRODUCTION: OIL (-183) TBD, GAS (-869) MCFD
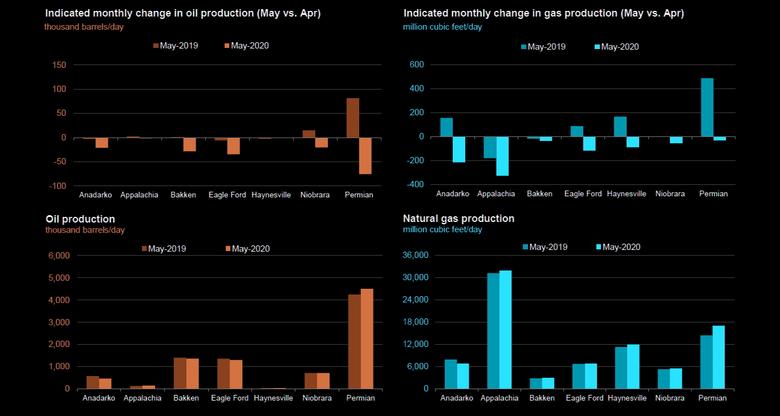
U.S. EIA - Crude oil production from the major US onshore regions is forecast to decrease 183,000 b/d month-over-month in April from 8,709 to 8,526 thousand barrels/day, gas production to decrease 869 million cubic feet/day from 84,027 to 83,158 million cubic feet/day .
| Oil production thousand barrels/day | Gas production million cubic feet/day | |||||
|---|---|---|---|---|---|---|
| Region | April 2020 | May 2020 | change | April 2020 | May 2020 | change |
| Anadarko | 483 | 462 | (21) | 7,047 | 6,831 | (216) |
| Appalachia | 148 | 146 | (2) | 32,215 | 31,889 | (326) |
| Bakken | 1,389 | 1,361 | (28) | 3,008 | 2,973 | (35) |
| Eagle Ford | 1,336 | 1,301 | (35) | 6,954 | 6,838 | (116) |
| Haynesville | 37 | 36 | (1) | 12,086 | 11,997 | (89) |
| Niobrara | 734 | 714 | (20) | 5,636 | 5,581 | (55) |
| Permian | 4,582 | 4,506 | (76) | 17,081 | 17,049 | (32) |
| Total | 8,709 | 8,526 | (183) | 84,027 | 83,158 | (869) |
| New-well oil production per rig barrels/day | New-well gas production per rig thousand cubic feet/day | ||||||
|---|---|---|---|---|---|---|---|
| Region | April 2020 | May 2020 | change | April 2020 | May 2020 | change | |
| Anadarko | 675 | 689 | 14 | 3,994 | 4,074 | 80 | |
| Appalachia | 133 | 136 | 3 | 14,583 | 14,874 | 291 | |
| Bakken | 1,249 | 1,274 | 25 | 1,965 | 2,004 | 39 | |
| Eagle Ford | 1,231 | 1,255 | 24 | 4,194 | 4,278 | 84 | |
| Haynesville | 22 | 23 | 1 | 9,782 | 9,977 | 195 | |
| Niobrara | 1,106 | 1,128 | 22 | 3,843 | 3,920 | 77 | |
| Permian | 677 | 690 | 13 | 1,347 | 1,374 | 27 | |
| Rig-weighted average | 730 | 741 | 11 | 3,420 | 3,471 | 51 | |
| Drilled but uncompleted wells (DUC) wells |
||||
| Region | February 2020 | March 2020 | change | |
| Anadarko | 728 | 676 | (52) | |
| Appalachia | 562 | 544 | (18) | |
| Bakken | 870 | 882 | 12 | |
| Eagle Ford | 1,368 | 1,350 | (18) | |
| Haynesville | 241 | 241 | - | |
| Niobrara | 453 | 442 | (11) | |
| Permian | 3,433 | 3,441 | 8 | |
| Total | 7,655 | 7,576 | (79) | |
-----
Earlier:

2020, April, 10, 11:55:00
U.S. RIGS DOWN 62 TO 602
U.S. Rig Count is down 62 rigs from last week to 602, Canada Rig Count is down 6 rigs from last week to 35
2020, April, 2, 14:45:00
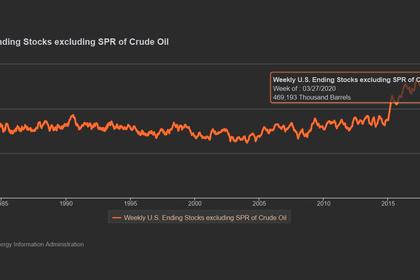
U.S. OIL STOCKS UP
U.S. Commercial crude stocks jumped 13.83 million barrels to 469.19 million barrels during the week
2020, April, 1, 12:35:00
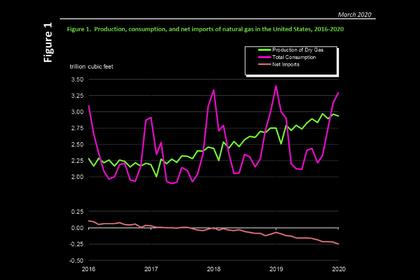
U.S. GAS PRODUCTION UP 7%
The preliminary level for dry natural gas production in January 2020 was 2,930 billion cubic feet (Bcf), or 94.5 Bcf/d. This level was 5.9 Bcf/d (6.7%) higher than the January 2019 level of 88.6 Bcf/d.
2020, March, 27, 13:45:00
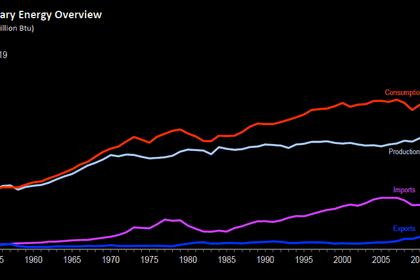
U.S. PRIMARY ENERGY CONSUMPTION 100 QUADRILLION BTU
U.S. primary energy consumption totaled 100 quadrillion Btu, a 1% decrease from 2018. Natural gas consumption increased 3%, renewable energy consumption and nuclear electric power consumption each increased less than 1%, petroleum consumption decreased less than 1%, and coal consumption decreased 14%.

