2020-04-06 14:05:00


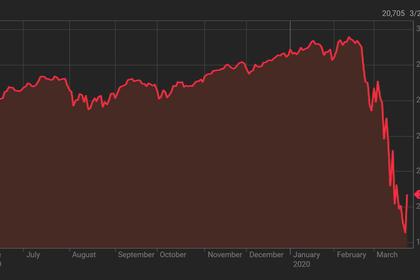
U.S. UNEMPLOYMENT 4.4%
U.S. BLS - April 3, 2020 - THE EMPLOYMENT SITUATION -- MARCH 2020
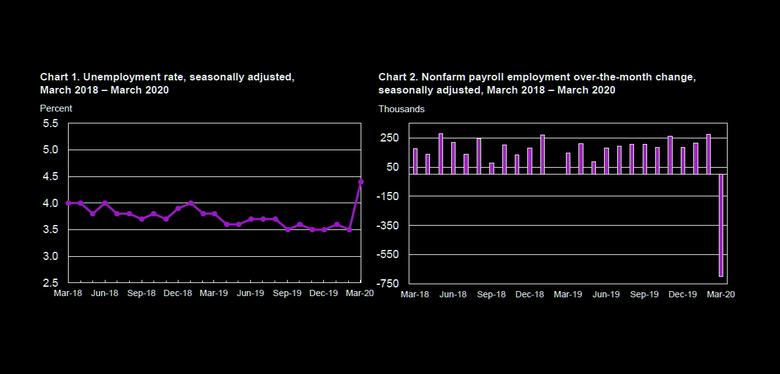
Total nonfarm payroll employment fell by 701,000 in March, and the unemployment rate rose to 4.4 percent, the U.S. Bureau of Labor Statistics reported today. The changes in these measures reflect the effects of the coronavirus (COVID-19) and efforts to contain it. Employment in leisure and hospitality fell by 459,000, mainly in food services and drinking places. Notable declines also occurred in health care and social assistance, professional and business services, retail trade, and construction.
This news release presents statistics from two monthly surveys. The household survey measures labor force status, including unemployment, by demographic characteristics. The establishment survey measures nonfarm employment, hours, and earnings by industry. Note that the March survey reference periods for both surveys predated many coronavirus-related business and school closures that occurred in the second half of the month. For more information about the concepts and statistical methodology used in these two surveys, see the Technical Note.
Household Survey Data
In March, the unemployment rate increased by 0.9 percentage point to 4.4 percent. This is the largest over-the-month increase in the rate since January 1975, when the increase was also 0.9 percentage point. The number of unemployed persons rose by 1.4 million to 7.1 million in March. The sharp increases in these measures reflect the effects of the coronavirus and efforts to contain it. (See table A-1. Measures from the household survey pertain to the week of March 8th to March 14th. For more information about how the household survey and its measures were affected by the coronavirus, see the box note at the end of this news release.)
In March, unemployment rates rose among all major worker groups. The rate was 4.0 percent for adult men, 4.0 percent for adult women, 14.3 percent for teenagers, 4.0 percent for Whites, 6.7 percent for Blacks, 4.1 percent for Asians, and 6.0 percent for Hispanics. (See tables A-1, A-2, and A-3.)
The number of unemployed persons who reported being on temporary layoff more than doubled in March to 1.8 million. The number of permanent job losers increased by 177,000 to 1.5 million. (See table A-11.)
The number of unemployed persons who were jobless less than 5 weeks increased by 1.5 million in March to 3.5 million, accounting for almost half of the unemployed. The number of long-term unemployed (those jobless for 27 weeks or more), at 1.2 million, was little changed in March and represented 15.9 percent of the unemployed. (See table A-12.)
The labor force participation rate, at 62.7 percent, decreased by 0.7 percentage point over the month. Total employment, as measured by the household survey, fell by 3.0 million to 155.8 million, and the employment-population ratio, at 60.0 percent, dropped by 1.1 percentage points over the month. (See table A-1.)
The number of persons employed part time for economic reasons, at 5.8 million, increased by 1.4 million in March. These individuals, who would have preferred full-time employment, were working part time because their hours had been reduced or they were unable to find full-time jobs. (See table A-8.)
In March, 1.4 million persons were marginally attached to the labor force, little changed from the previous month. These individuals were not in the labor force, wanted and were available for work, and had looked for a job sometime in the prior 12 months but had not looked for work in the 4 weeks preceding the survey. Discouraged workers, a subset of the marginally attached who believed that no jobs were available for them, numbered 514,000 in March, up by 109,000 from the previous month. (See Summary table A.)
Establishment Survey Data
Total nonfarm payroll employment fell sharply in March (-701,000), reflecting the effects of the coronavirus and efforts to contain it. About two-thirds of the drop occurred in leisure and hospitality, mainly in food services and drinking places. Notable employment declines also occurred in health care and social assistance, professional and business services, retail trade, and construction. In the prior 12 months, nonfarm employment growth had averaged 196,000 per month. (See table B-1. Measures from the establishment survey pertain to the pay period including March 12th; pay periods may be weekly, bi-weekly, semi-monthly, or monthly. For more information about the establishment survey reference period and how survey operations were affected by the coronavirus, see the box note at the end of this news release.)
In March, employment in leisure and hospitality fell by 459,000. Most of the decline occurred in food services and drinking places (-417,000); this employment decline nearly offset gains over the previous 2 years. Employment in the accommodation industry also declined in March (-29,000).
Employment in health care and social assistance fell by 61,000 in March. Health care employment declined by 43,000, with job losses in offices of dentists (-17,000), offices of physicians (-12,000), and offices of other health care practitioners (-7,000). Over the prior 12 months, health care employment had grown by 374,000. In March, social assistance saw an employment decline of 19,000, reflecting a job loss in child day care services (-19,000). Over the prior 12 months, social assistance added 193,000 jobs.
Employment in professional and business services decreased by 52,000 in March, with the decline concentrated in temporary help services (-50,000). Employment also decreased in travel arrangement and reservation services (-7,000).
In March, employment in retail trade declined by 46,000. Job losses occurred in clothing and clothing accessories stores (-16,000); furniture stores (-10,000); and sporting goods, hobby, book, and music stores (-9,000). General merchandise stores gained 10,000 jobs.
Employment decreased over the month in construction (-29,000). In March, nonresidential building (-11,000) and heavy and civil engineering construction (-10,000) lost jobs. Construction employment had increased by 211,000 over the prior 12 months. Employment in the other services industry declined by 24,000 in March, with about half of the loss occurring in personal and laundry services (-13,000). Over the prior 12 months, other services had added 89,000 jobs.
Mining lost 6,000 jobs in March, with much of the decline occurring in support activities for mining (-5,000). Since a recent peak in January 2019, mining employment has declined by 42,000.
In March, manufacturing employment edged down (-18,000). Over the past 12 months, employment in the industry has shown little net change.
Federal government employment rose by 18,000 in March, reflecting the hiring of 17,000 workers for the 2020 Census.
Employment in other major industries, including wholesale trade, transportation and warehousing, information, and financial activities, changed little over the month.
In March, average hourly earnings for all employees on private nonfarm payrolls increased by 11 cents to $28.62. Over the past 12 months, average hourly earnings have increased by 3.1 percent. Average hourly earnings of private-sector production and nonsupervisory employees increased by 10 cents to $24.07 in March. (See tables B-3 and B-8.)
The average workweek for all employees on private nonfarm payrolls fell by 0.2 hour to 34.2 hours in March. The decline in the average workweek was most pronounced in leisure and hospitality, where average weekly hours dropped by 1.4 hours. In manufacturing, the workweek declined by 0.3 hour to 40.4 hours, and overtime declined by 0.2 hour to 3.0 hours. The average workweek for production and nonsupervisory employees on private nonfarm payrolls decreased by 0.3 hour to 33.4 hours. (See tables B-2 and B-7.)
The change in total nonfarm payroll employment for January was revised down by 59,000 from +273,000 to +214,000, and the change for February was revised up by 2,000 from +273,000 to +275,000. With these revisions, employment gains in January and February combined were 57,000 lower than previously reported. (Monthly revisions result from additional reports received from businesses and government agencies since the last published estimates and from the recalculation of seasonal factors.) After revisions, job gains averaged 245,000 per month for January and February.
-----
Earlier:
2020, April, 3, 11:55:00
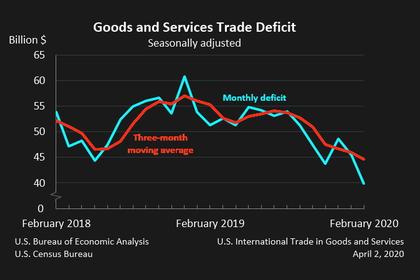
U.S. INTERNATIONAL TRADE DEFICIT $39.9 BLN
The U.S. Census Bureau and the U.S. Bureau of Economic Analysis announced today that the goods and services deficit was $39.9 billion in February, down $5.5 billion from $45.5 billion in January, revised.
2020, March, 27, 13:20:00
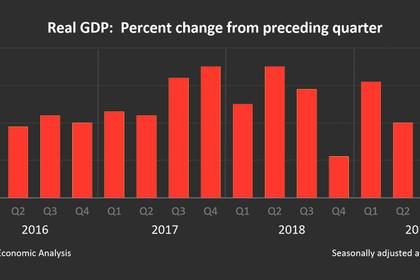
U.S. GDP UP 2.1% ANEW
U.S. real gross domestic product (GDP) increased at an annual rate of 2.1 percent in the fourth quarter of 2019