2020-05-27 11:55:00


U.S. GAS CONSUMPTION WILL DOWN
U.S. EIA - In April, the Henry Hub natural gas spot price averaged $1.73 per million British thermal units (MMBtu). EIA forecasts that natural gas prices will generally rise through the rest of 2020 as U.S. production declines. EIA forecasts that Henry Hub natural gas spot prices will average $2.14/MMBtu in 2020 and then increase in 2021, reaching an annual average of $2.89/MMBtu. EIA expects prices to rise largely because of lower natural gas production compared with 2020.
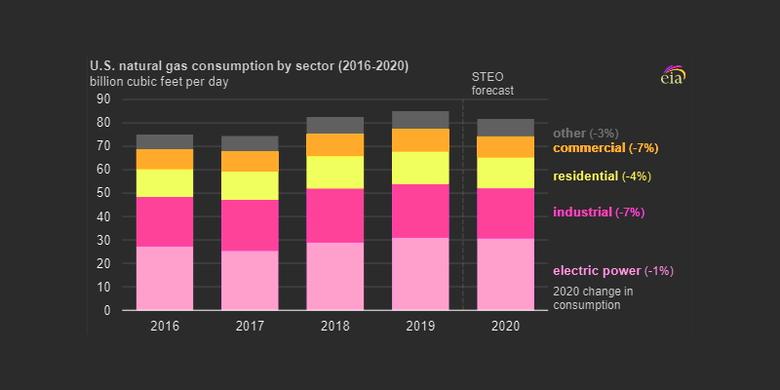
EIA expects total consumption of natural gas to average 81.7 billion cubic feet per day (Bcf/d) in 2020, down 3.9% from the 2019 average primarily because of lower industrial sector consumption of natural gas. EIA forecasts industrial natural gas consumption to average 21.3 Bcf/d in 2020, down 7.1% from 2019 as a result of lower expected manufacturing activity. This expected decline is lower than the 0.3% decline forecast in the April STEO because of large downward revisions to the macroeconomic forecast in the May STEO.
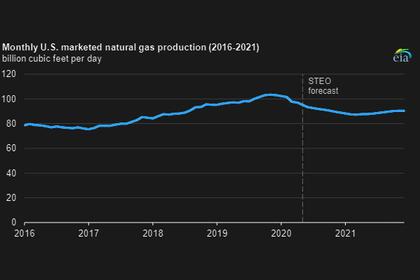
U.S. dry natural gas production set a record in 2019, averaging 92.2 Bcf/d. EIA forecasts dry natural gas production will average 89.8 Bcf/d in 2020, with monthly production falling from an estimated 93.1 Bcf/d in April to 85.4 Bcf/d in December.
Natural gas production declines the most in the Appalachian region and Permian region. In the Appalachian region, low natural gas prices are discouraging producers from engaging in natural gas-directed drilling, and in the Permian region, low oil prices reduce associated gas output from oil-directed wells. In 2021, forecast dry natural gas production averages 84.9 Bcf/d, rising in the second half of 2021 in response to higher prices.
EIA estimates that total U.S. working natural gas in storage ended April at 2.3 trillion cubic feet (Tcf), 20% more than the five-year (2015–19) average. In the forecast, inventories rise by 2.1 Tcf during the April through October injection season to reach almost 4.2 Tcf on October 31, which would be a record level.
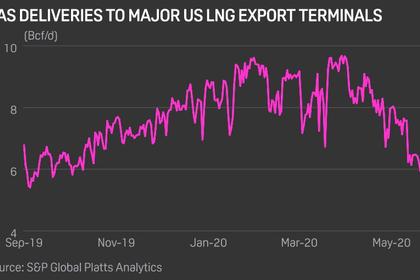
EIA forecasts that U.S. liquefied natural gas exports will average 5.8 Bcf/d in the second quarter of 2020 and 4.8 Bcf/d in the third quarter of 2020. U.S. liquefied natural gas exports are expected to decline through the end of the summer as a result of lower expected global demand for natural gas.
-----
Earlier:
2020, May, 25, 12:45:00
U.S. ENERGY MARKET DOWN
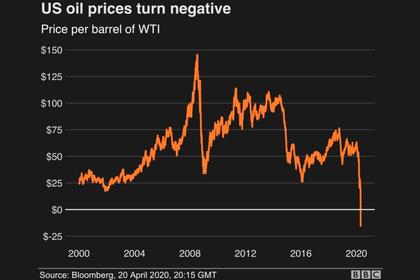
Oil markets are being significantly disrupted due to global market dynamics and the coronavirus pandemic, the oil price crash was "causing financial and credit challenges, including oil company bankruptcies."
2020, May, 22, 12:50:00
U.S. LNG CANCELED
The July cancellations, roughly double what was reported for June, represent nearly two-thirds the average volume of US LNG that was produced monthly when the coronavirus began to spread globally in January,
2020, May, 19, 11:50:00
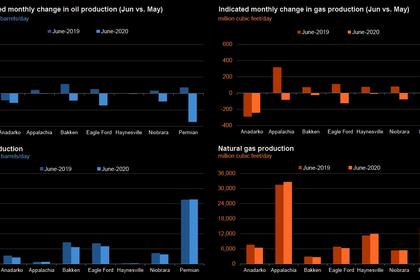
U.S. PRODUCTION: OIL (-197) TBD, GAS (-779) MCFD
Crude oil production from the major US onshore regions is forecast to decrease 197,000 b/d month-over-month in May from 8,019 to 7,822 thousand barrels/day, gas production to decrease 779 million cubic feet/day from 82,249 to 81,470 million cubic feet/day .
2020, May, 18, 08:40:00
U.S. GAS PRODUCTION WILL DOWN
U.S. dry natural gas production set a record in 2019, averaging 92.2 Bcf/d. EIA forecasts dry natural gas production will average 89.8 Bcf/d in 2020, with monthly
production falling from an estimated 93.1 Bcf/d in April to 85.4 Bcf/d in December.


