2020-05-21 12:30:00


U.S. POWER GRID DOWN 5.8%
By Carl Popolo CEO Advanced Energy Intelligence, LLC
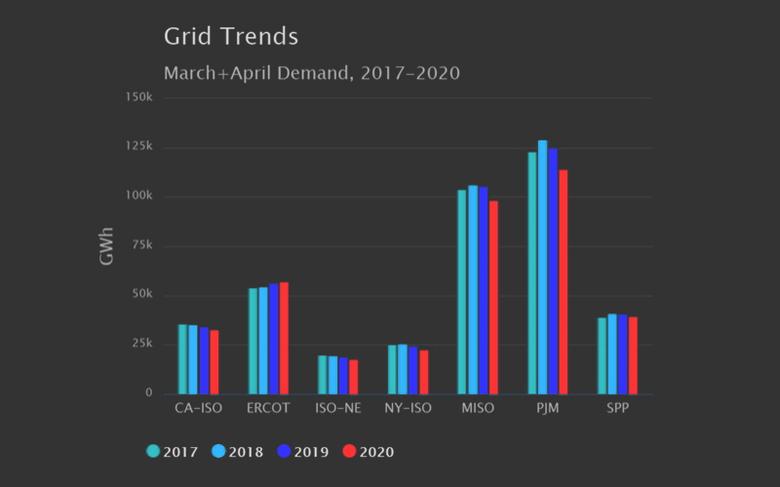
ENERGYCENTRAL - May 18, 2020 - In an attempt to roughly gauge the effect of the COVID-19 pandemic on electricity demand in the U.S., we looked at the self-reported loads across 7 major grids responsible for about 60% of U.S. electric power supply during the nine-week period from early March through early May. We found a weighted-average 5.8% decrease in demand for 2020 versus the same period in 2019. The drop represents a reduction of 23,372 gigawatt-hour (GWh) in the nine-week period or, when annualized strictly on a calendar basis, a decrease of about 135 terawatt-hour (TWh) or 95.5 million metric tons of CO2e (www.epa.gov).

In our methodology, we took the simple average of the 5-minute, 15-minute or hourly real-time loads for each ISO/RTO during a 9-week period starting on the first Sunday in March for the four years from 2017 to 2020. We did not account for weather, but a logical next step would be to normalize for total heating and cooling degree-days for each region some day when EIA has published the 2020 data. The data as shown in the table below the chart in Figure 1 is stated in gigawatt-hours after multiplying the average demand by the 1,512 hours of the 63-day period.
The largest percentage drops were found in the PJM and NYISO service areas. We are reluctant to speculate beyond what the data allows, but perhaps the fact that NY and NJ were earlier to the COVID-19 response came with a decrease in demand consistent with their longer lock-downs. Texas has been on a four-year upward trend and this year was no different – ERCOT was the only grid to show an increase between 2019 and 2020 and any effect due to the pandemic might have also been tempered by that state’s relatively late response.
That led us to look anecdotally at what's happening in some of the buildings we watch. Boston Public Library at Copley – a big building at close to 1 million square feet – still moves from its setback load of about 650 kW to 1 megawatt every morning at 6am and remains there until around 9pm even though the BPL website shows this building as “closed until further notice”. This is a 930,000 ft2 building that should be in an unoccupied state and yet it’s usage is up by 7.3% compared to the previous month before the shutdown and the profile difference is only 21.7% lower this year over last. We fully expect that the library is still occupied to some extent – perhaps taking advantage of the closure to do maintenance or project work that would be cumbersome during normal times, or to get ahead on a renovation that can safely be done during the shutdown.
 versus 2019 (left). The most notable features of the overall reduction of 8.8% are that the weekend and weekday profiles are more closely matched in 2020, and the slight surge during weekday startup hours is noticeably muted compared to 2019.")
Smaller buildings are not immune. Several that we monitor have simply gone into night and weekend setback and for all we know they may have essential operations that are still up and running. For example, we expect to see normal load patterns in a town hall that also happens to house the police department. But a small school that normally peaks around 70 kW during a busy lunch hour probably doesn’t need to be at 30 kW 24/7 during a state-wide shutdown during the shoulder season.
 versus 2019 (left). The average daily profiles 2020 are markedly different but there’s still a daytime load of about 400 kW from 6am to 9pm, seven days a week above the nominal base load of just under 700 kW.")
We’re not trying to beat up on the buildings. The point is to try to understand whether a stopped economy is having any kind of meaningful effect on the grid – an effect that might manifest itself in new ways, and maybe some of those are positive? What does a grid peak hour even look like this summer? Do times like this signal a new respect for dispatchable energy sources or mark a permanent shift in the commercial/residential dynamic? Maybe a temporary 6% overall effect is not material to the grid as we know it for the long term, but it could be a significant factor in the supply and demand mix and how investors perceive any shift as a new and permanent state. Ideally, any reaction moves us forward on the sustainability and reliability spectrum.
We’ve heard that ASHRAE is recommending new ventilation requirements for buildings – like 100% outside air along with a warning against the use of demand control ventilation. That would seem to be a step forward in terms of occupant health but does come with an increase in the energy cost. For a similar but more discerned approach, Enel X also did a review of their own supply data and by knowing their customers as they do, they can better allocate the increases and decreases by economic sector.
-----
This thought leadership article was originally shared with Energy Central's Load Management Community Group. The communities are a place where professionals in the power industry can share, learn and connect in a collaborative environment. Join the Load Management group today and learn from others who work in the industry.
-----
Earlier:
2020, May, 20, 11:45:00
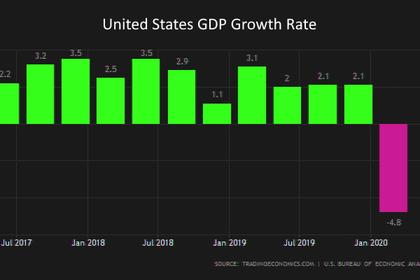
U.S. ECONOMY WILL DOWN BY 37%
the U.S. economy would contract at a 37.7% annual rate in the second quarter, but expand at a 21.5% pace in the July-September period.
2020, May, 18, 08:35:00
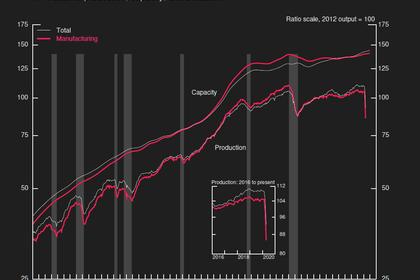
U.S. INDUSTRIAL PRODUCTION FELL 11.2%
U.S. total industrial production fell 11.2 percent in April for its largest monthly drop in the 101-year history of the index
2020, May, 15, 11:50:00
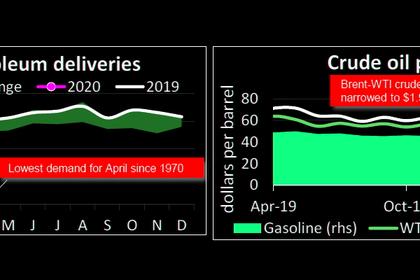
U.S. OIL DEMAND DOWN TO 14.2 MBD
Reduced economic activity resulting from shelter-in-place restrictions due to COVID-19 drove significant near-term disruptions to energy markets in the month of April with U.S. petroleum demand falling nearly 27 percent to 14.2 million barrels per day (mb/d),
2020, May, 12, 14:25:00
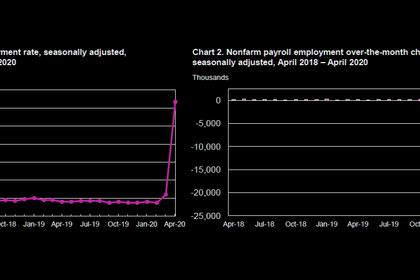
U.S. EMPLOYMENT DOWN BY 20.5 MLN
Total U.S. nonfarm payroll employment fell by 20.5 million in April,


