2020-05-19 11:50:00
U.S. PRODUCTION: OIL (-197) TBD, GAS (-779) MCFD
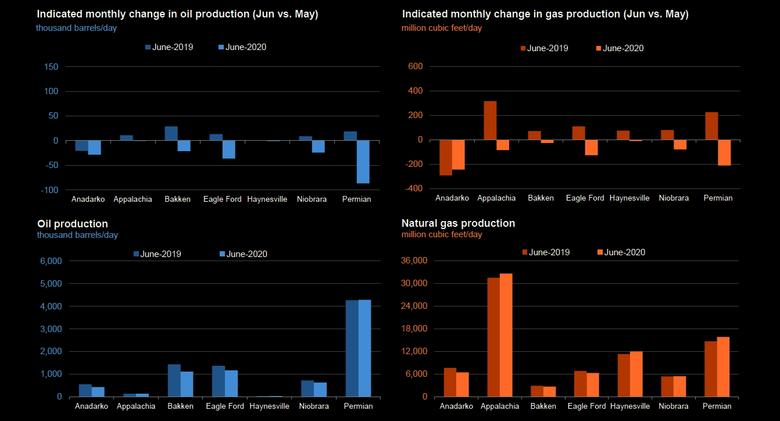
U.S. EIA - May 18, 2020 - Crude oil production from the major US onshore regions is forecast to decrease 197,000 b/d month-over-month in May from 8,019 to 7,822 thousand barrels/day, gas production to decrease 779 million cubic feet/day from 82,249 to 81,470 million cubic feet/day .
| Oil production thousand barrels/day | Gas production million cubic feet/day | |||||
|---|---|---|---|---|---|---|
| Region | May 2020 | June 2020 | change | May 2020 | June 2020 | change |
| Anadarko | 462 | 434 | (28) | 6,730 | 6,486 | (244) |
| Appalachia | 138 | 138 | - | 32,678 | 32,593 | (85) |
| Bakken | 1,135 | 1,114 | (21) | 2,770 | 2,744 | (26) |
| Eagle Ford | 1,210 | 1,174 | (36) | 6,479 | 6,353 | (126) |
| Haynesville | 37 | 36 | (1) | 12,018 | 12,008 | (10) |
| Niobrara | 660 | 636 | (24) | 5,525 | 5,447 | (78) |
| Permian | 4,377 | 4,290 | (87) | 16,049 | 15,839 | (210) |
| Total | 8,019 | 7,822 | (197) | 82,249 | 81,470 | (779) |
| New-well oil production per rig barrels/day | New-well gas production per rig thousand cubic feet/day | |||||
|---|---|---|---|---|---|---|
| Region | May 2020 | June 2020 | change | May 2020 | June 2020 | change |
| Anadarko | 551 | 717 | 166 | 3,256 | 4,233 | 977 |
| Appalachia | 145 | 146 | 1 | 19,631 | 19,828 | 197 |
| Bakken | 1,109 | 1,309 | 200 | 1,830 | 2,159 | 329 |
| Eagle Ford | 1,288 | 1,519 | 231 | 4,441 | 5,240 | 799 |
| Haynesville | 23 | 24 | 1 | 10,976 | 11,196 | 220 |
| Niobrara | 1,213 | 1,274 | 61 | 4,283 | 4,497 | 214 |
| Permian | 717 | 795 | 78 | 1,428 | 1,585 | 157 |
| Rig-weighted average | 745 | 809 | 64 | 3,867 | 4,524 | 657 |
| Drilled but uncompleted wells (DUC) wells |
||||
| Region | March 2020 | April 2020 | change | |
| Anadarko | 691 | 666 | (25) | |
| Appalachia | 536 | 527 | (9) | |
| Bakken | 888 | 898 | 10 | |
| Eagle Ford | 1,356 | 1,357 | 1 | |
| Haynesville | 244 | 245 | 1 | |
| Niobrara | 453 | 460 | 7 | |
| Permian | 3,436 | 3,464 | 28 | |
| Total | 7,604 | 7,617 | 13 | |
-----
Earlier:
2020, May, 18, 08:40:00
U.S. GAS PRODUCTION WILL DOWN
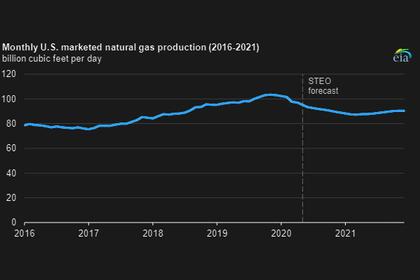
U.S. dry natural gas production set a record in 2019, averaging 92.2 Bcf/d. EIA forecasts dry natural gas production will average 89.8 Bcf/d in 2020, with monthly
production falling from an estimated 93.1 Bcf/d in April to 85.4 Bcf/d in December.
2020, May, 15, 11:50:00
U.S. OIL DEMAND DOWN TO 14.2 MBD
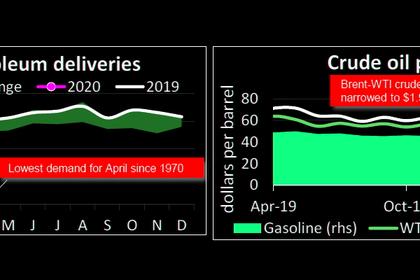
Reduced economic activity resulting from shelter-in-place restrictions due to COVID-19 drove significant near-term disruptions to energy markets in the month of April with U.S. petroleum demand falling nearly 27 percent to 14.2 million barrels per day (mb/d),
2020, May, 14, 16:10:00
U.S. OIL DEMAND UPDOWN
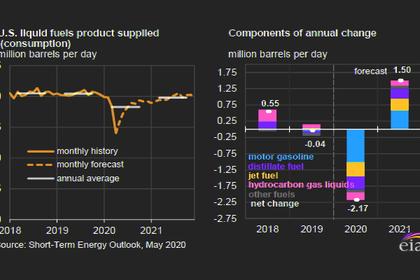
EIA expects U.S. total liquid fuels consumption will rise from an average of 15.9 million b/d in the second quarter of 2020 to 18.7 million b/d in the third quarter of 2020 and then to average 19.8 million b/d in 2021, up 8% from 2020, but lower than 2019 levels.
2020, May, 12, 14:25:00
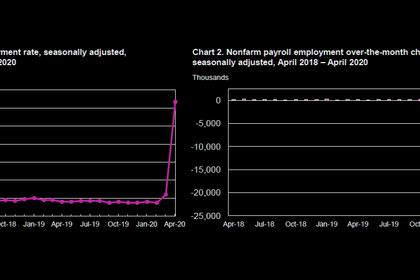
U.S. EMPLOYMENT DOWN BY 20.5 MLN
Total U.S. nonfarm payroll employment fell by 20.5 million in April,


