2020-05-12 14:40:00


U.S. TIGHT OIL PRODUCTION WILL DOWN TO 6 MBD
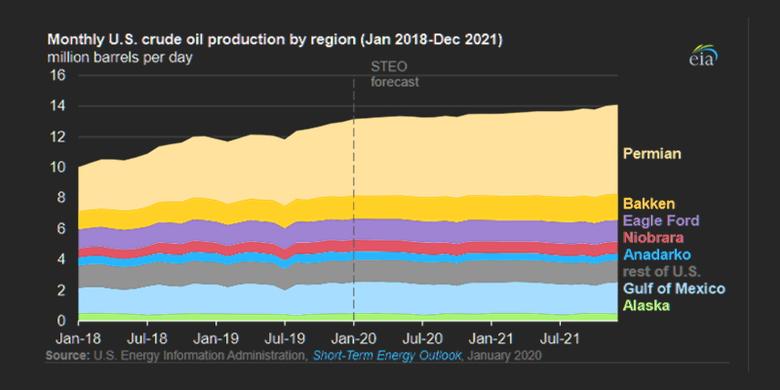

Total production
Oil production from these wells started the year with a minor drop m-o-m, as several states reported a decline. Still, y-o-y growth in January was about 0.8 million bo/d (after upcoming revisions).
Reeves County in the Delaware Basin (TX) recently overtook McKenzie in North Dakota in terms of daily oil production, although Lea County (NM), also in the Delaware Basin, is catching up quickly.
Supply Projection dashboard
Obviously, the situation radically changed 2 months ago and drilling activity is now only half the level in January. Last week 51 fewer rigs were drilling horizontal wells , according to the Baker Hughes rig count. In our publicly available Supply Projection dashboard we found that long-term oil & gas output dropped by 0.7 million bo/d and 4.3 Bcf/d, after this data became available.
If nothing else changes (unlikely), tight oil production will decline to a level of about 6 million bo/d from here:

Tight oil projection based on the latest horizontal rig count
You can use the parameters in this dashboard to change the future rig count and rig/well productivity, in order to make your own projections. If you missed our webinar on this dashboard, you can still find a recording here: Supply Projection webinar (YouTube)
Top operators
Last week we finished our M&A mapping capability. Now M&A transactions are correctly represented in our services. For example, Occidental’s acquisition of Anadarko is now reflected in the “Top operators” overview, and it is now clearly the number 2 tight oil operator, after EOG. If you believe we have missed an acquisition, just let us know and we’ll include it!
Advanced Insights

This “Ultimate recovery” overview shows the relationship between production rates and cumulative production over time. The oil basins are preselected and the wells are grouped by the year in which production started. More recent and granular data can be seen if you group the wells by quarter or month of first production.
Finally
Later this week we will have a new post on North Dakota, which just released March production data for almost all wells (available already in our subscription services).
Production data is subject to revisions.
Visit our blog to read the full post and use the interactive dashboards to gain more insight: https://bit.ly/3dfVkjK
Follow us on Social Media:
Twitter: @ShaleProfile
LinkedIn: ShaleProfile
Facebook: ShaleProfile
-----
This thought leadership article was originally shared with Energy Central's Energy Collective Group. The communities are a place where professionals in the power industry can share, learn and connect in a collaborative environment. Join the Energy Collective Group today and learn from others who work in the industry.
-----

