2020-07-30 12:20:00


U.S. ENERGY CONSUMPTION DOWN
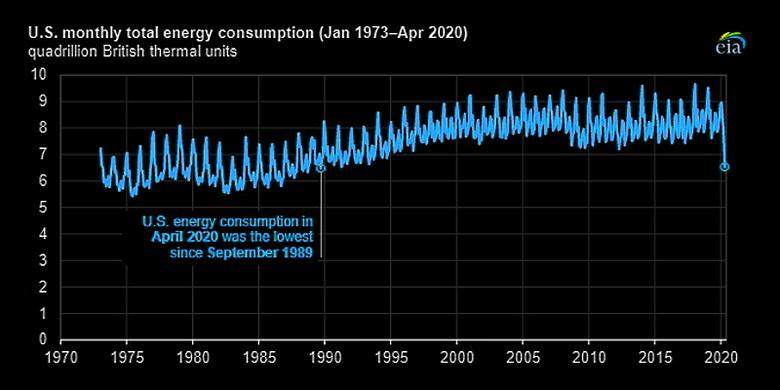
U.S. EIA - JULY 29, 2020 - According to the U.S. Energy Information Administration’s (EIA) most recent Monthly Energy Review, the United States consumed 6.5 quadrillion British thermal units of energy in April 2020, the lowest monthly energy consumption since September 1989. Energy consumption in April 2020 was 14% lower than in April 2019, the largest year-over-year decrease in EIA’s monthly total energy consumption, a data series that dates back to 1973.
Before April 2020, the largest year-over-year change in U.S. total energy consumption occurred between December 2000 and December 2001, when consumption decreased by about 10% because of economic and weather-related factors. The third-largest decrease was between March 2019 and March 2020.
April is a month with relatively low energy consumption in the United States: in 14 of the past 20 years, April has been the month with the lowest total energy consumption in the year. April’s typically mild temperatures reduce energy demand for heating and cooling. In 2020, April was the height of stay-at-home measures enacted to mitigate the spread of COVID-19, which caused a large drop in transportation, industrial, and commercial sector energy consumption.
 in April 2019 to 14.7 million b/d in April 2020,")
U.S. petroleum consumption fell from 20.1 million barrels per day (b/d) in April 2019 to 14.7 million b/d in April 2020, a 27% decrease and the lowest monthly petroleum consumption in the United States since May 1983. Stay-at-home orders and other travel limitations caused petroleum product supplied (a proxy for consumption) for fuels such as motor gasoline and jet fuel to fall to their lowest levels in decades.
, a 2% increase in consumption from 73.4 Bcf/d in April 2019")
Natural gas consumption in April 2020 was 74.9 billion cubic feet per day (Bcf/d), a 2% increase in consumption from 73.4 Bcf/d in April 2019. Residential consumption of natural gas, which was likely affected by stay-at-home orders, was 15% higher in April 2020 than in April 2019, and residential consumption was the main factor leading to the increase in total natural gas consumption. Natural gas is the most common residential heating fuel in the United States, and April 2020 was about 24% colder than the previous April, as measured by population-weighted heating degree days. Consumption of natural gas in the electric power sector has also increased in 2020 because of historically low natural gas prices.

Coal consumption, which has declined since its 2007 peak, fell to its lowest point in EIA’s monthly records in April. The 27.4 million short tons of coal consumed in April 2020 was 27% less than the 37.4 million short tons consumed in April 2019. The electric power sector accounted for nearly all of coal’s year-over-year decline, falling from 33.5 million short tons to 23.6 million short tons from April 2019 to April 2020.
, a 4% decrease from April 2019 and its lowest level since November 2001.")
Electricity end-use consumption in April 2020 totaled less than 269 billion kilowatthours (kWh), a 4% decrease from April 2019 and its lowest level since November 2001. Consumption of electricity by the commercial and industrial sectors declined by 11% and 9%, respectively, from levels in April 2019. Residential sector electricity consumption increased from 90 billion kWh in April 2019 to 97 billion kWh in April 2020, an 8% increase. Natural gas-fired power plants provided the largest share of electricity generation in April 2020; coal’s share of electricity generation (15%) was lower than natural gas (39%) and nuclear (22%).
EIA’s Short-Term Energy Outlook forecasts that U.S. total energy consumption will increase from its low point in April but remain lower than 2019 levels for the rest of 2020. More information on total energy consumption is available in EIA’s Monthly Energy Review.
-----
Earlier:

2020, July, 27, 16:15:00
U.S. ENERGY CONVERSION LOSS
U.S. utility-scale generation facilities consumed 38 quadrillion British thermal units (quads) of energy to provide 14 quads of electricity.
2020, July, 27, 16:10:00
U.S. COAL DOWN
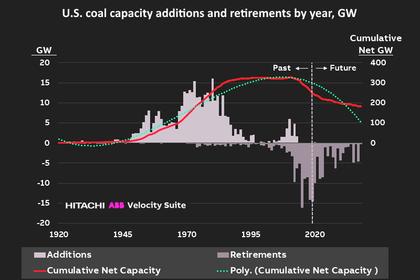
For the better part of three decades, from 1985 through 2014, net operating coal capacity in the United States exceeded 300 GW. By the end of 2020, it is expected to drop below 240 GW for the first time since 1978, and by 2030, based on plants scheduled for retirement, net capacity is expected to dip below 200 GW for the first time since 1975.
2020, July, 14, 13:10:00
U.S. PRODUCTION: OIL (-56) TBD, GAS (-712) MCFD
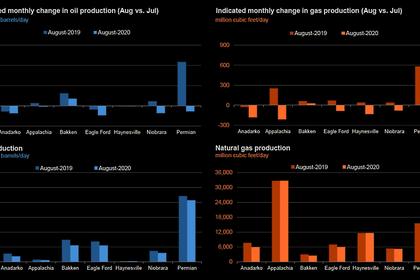
Crude oil production from the major US onshore regions is forecast to decrease 56,000 b/d month-over-month in July from 7,546 to 7,490 thousand barrels/day, gas production to decrease 712 million cubic feet/day from 80,266 to 79,554 million cubic feet/day .
2020, July, 6, 10:55:00
U.S. ENERGY LOOSES
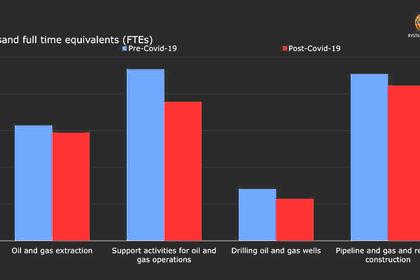
U.S. oil and gas extraction businesses shed 1,200 jobs last month.
2020, July, 2, 11:45:00
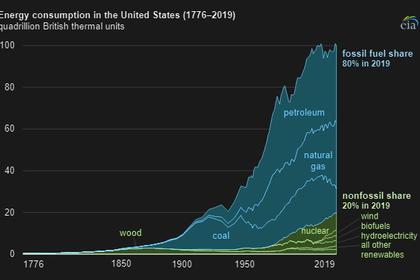
U.S. NONFOSSIL SOURCES: 20%
About 20% of U.S. energy consumption in 2019 came from sources other than fossil fuels


