2020-07-02 11:45:00


U.S. NONFOSSIL SOURCES: 20%
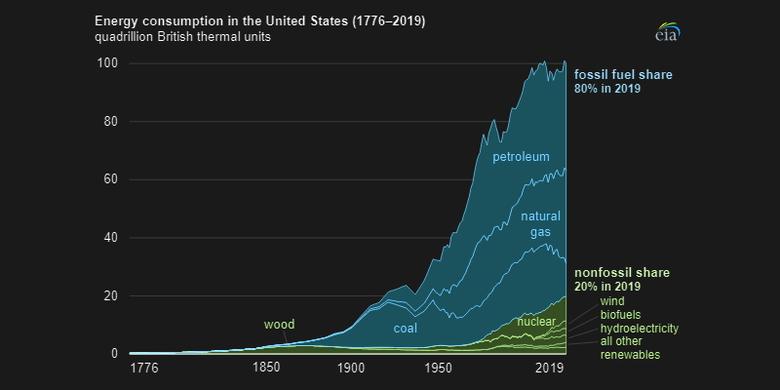
U.S. EIA - JULY 1, 2020 - Overall energy consumption in the United States totaled 100 quadrillion British thermal units (Btu) in 2019, only slightly less than the record set in 2018 and the third-highest level of annual U.S. energy consumption ever. About 20% of U.S. energy consumption in 2019 came from sources other than fossil fuels. Several energy sources hit record consumption values in 2019, based on data in the U.S. Energy Information Administration’s (EIA) Monthly Energy Review: natural gas, nuclear, wind, and solar.
Increases in nuclear and renewables consumption in 2019 resulted in the nonfossil share rising to 20% of total U.S. energy consumption. As coal, petroleum, and natural gas were developed, the nonfossil share fell from 100% in the mid-1800s to 6% in the 1960s and has since slowly increased as consumption of nuclear, hydroelectricity, wind, biofuels, and solar have grown. U.S. fossil fuel consumption peaked at 86 quadrillion Btu in 2007 and has since fallen to 80 quadrillion Btu in 2019, a 7% decline.
Petroleum has been the most-consumed energy source in the United States since surpassing coal in 1950. U.S. petroleum consumption remains lower than its peak in 2005 and most recently totaled 36.7 quadrillion Btu in 2019.

U.S. natural gas consumption reached a record of 32.1 quadrillion Btu in 2019. U.S. natural gas consumption growth has largely been driven by increased use in the electric power sector, which has consumed more natural gas than any other sector in four of the past five years.
U.S. coal consumption fell by 15% in 2019, marking one of the largest annual declines for consumption of any energy source. U.S. coal consumption has fallen by more than half since its peak in 2005; much of this decline has been driven by reduced coal use in the electric power sector. In 2019, U.S. coal consumption fell to 587 million short tons, the lowest level since the 1970s.
Nuclear energy contributed a record 8.5 quadrillion Btu, or 809 million megawatthours, to U.S. energy consumption in 2019. Nuclear power plants operated at record levels—94% of their capacity—which allowed nuclear electricity generation in 2019 to surpass the 2018 level despite the retirement of two plants: Massachusetts’s Pilgrim and Pennsylvania’s Three Mile Island.

U.S. renewable energy consumption in 2019 reached 11.5 quadrillion Btu, surpassing U.S. coal consumption for the first time in 130 years. The largest growth in renewables during the past decade has been solar and wind electricity generation.
In 2019, wind energy surpassed hydroelectricity to become the largest source of renewable energy consumption in the United States. The energy content of wind consumption in 2019 (2.7 quadrillion Btu) was nearly the same as the energy content of wood consumption in the mid- to late-1800s, when coal and petroleum fuels were first being developed and wood was the predominant energy source in the United States.
The Monthly Energy Review's pre-1949 estimates of U.S. energy use are based on two sources: Sam Schurr and Bruce Netschert’s Energy in the American Economy, 1850–1975: Its History and Prospects and the U.S. Department of Agriculture’s Circular No. 641, Fuel Wood Used in the United States 1630–1930, published in 1942.
Appendix D of EIA’s Monthly Energy Review compiles these estimates of U.S. energy consumption in 10-year increments from 1635 through 1845 and 5-year increments from 1845 through 1945. Data for 1949 through the present day are available in the latest Monthly Energy Review.
-----


