2020-07-30 12:15:00


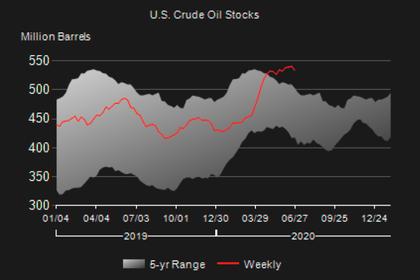
U.S. OIL INVENTORIES DOWN BY 10.6 MB TO 526.0 MB
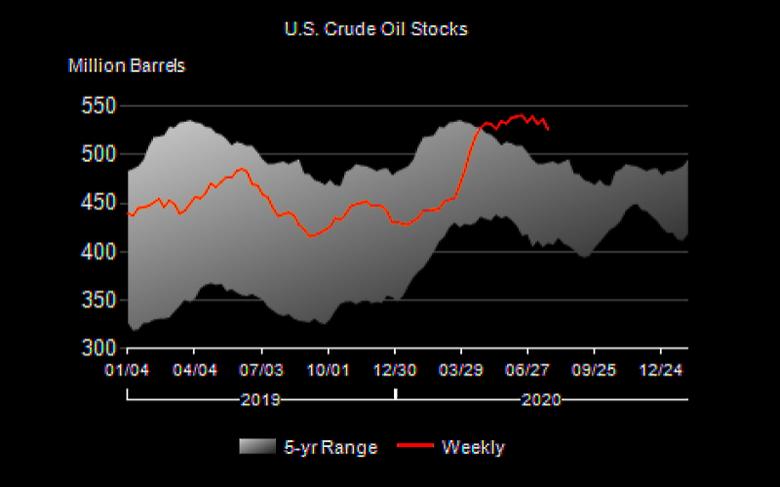
U.S. EIA - July 29, 2020 - Data for Week Ended: July 24, 2020
Summary of Weekly Petroleum Status Report
U.S. crude oil refinery inputs averaged 14.6 million barrels per day during the week ending July 24, 2020 which was 389,000 barrels per day more than the previous week's average. Refineries operated at 79.5% of their operable capacity last week. Gasoline production increased last week, averaging 9.2 million barrels per day. Distillate fuel production increased last week, averaging 4.8 million barrels per day.
U.S. crude oil imports averaged 5.1 million barrels per day last week, decreased by 0.8 million barrels per day from the previous week. Over the past four weeks, crude oil imports averaged about 6.0 million barrels per day, 13.6% less than the same four-week period last year. Total motor gasoline imports (including both finished gasoline and gasoline blending components) last week averaged 924,000 barrels per day, and distillate fuel imports averaged 148,000 barrels per day.
U.S. commercial crude oil inventories (excluding those in the Strategic Petroleum Reserve) decreased by 10.6 million barrels from the previous week. At 526.0 million barrels, U.S. crude oil inventories are about 17% above the five year average for this time of year. Total motor gasoline inventories increased by 0.7 million barrels last week and are about 8% above the five year average for this time of year. Finished gasoline and blending components inventories both increased last week. Distillate fuel inventories increased by 0.5 million barrels last week and are about 26% above the five year average for this time of year. Propane/propylene inventories increased by 2.0 million barrels last week and are about 12% above the five year average for this time of year. Total commercial petroleum inventories decreased last week by 6.5 million barrels last week.
Total products supplied over the last four-week period averaged 18.3 million barrels a day, down by 13.1% from the same period last year. Over the past four weeks, motor gasoline product supplied averaged 8.7 million barrels a day, down by 9.0% from the same period last year. Distillate fuel product supplied averaged 3.4 million barrels a day more than the past four weeks, down by 11.1% from the same period last year. Jet fuel product supplied was down 42.1% compared with the same fourweek period last year.
The West Texas Intermediate crude oil price was $41.23 per barrel on July 24, 2020, $0.68 above last week's price but $14.81 less than a year ago. The spot price for conventional gasoline in the New York Harbor was $1.245 per gallon, $0.048 more than last week's price but $0.621 below a year ago. The spot price for ultra-low sulfur diesel fuel in the New York Harbor was $1.262 per gallon, $0.038 above last week's price but $0.642 under a year ago.
The national average retail regular gasoline price was $2.175 per gallon on July 27, 2020, $0.011 lower than last week's price and $0.540 under a year ago. The national average retail diesel fuel price was $2.427 per gallon, $0.006 per gallon below last week's level and $0.607 under a year ago.
-----
Earlier:
2020, July, 16, 16:20:00
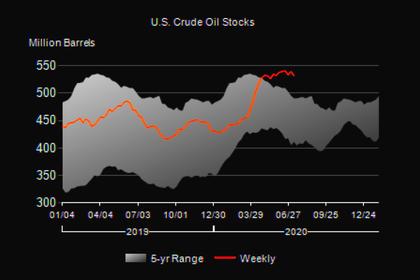
U.S. OIL INVENTORIES DOWN BY 7.5 MB TO 531.7 MB
U.S. commercial crude oildecreased by 7.5 million barrels from the previous week to 531.7 million barrels
2020, July, 14, 13:10:00
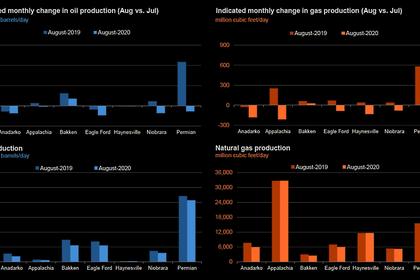
U.S. PRODUCTION: OIL (-56) TBD, GAS (-712) MCFD
Crude oil production from the major US onshore regions is forecast to decrease 56,000 b/d month-over-month in July from 7,546 to 7,490 thousand barrels/day, gas production to decrease 712 million cubic feet/day from 80,266 to 79,554 million cubic feet/day .

2020, July, 14, 12:10:00
U.S. RIGS DOWN 5 TO 258
U.S. Rig Count is down 5 rigs from last week to 258, Canada Rig Count is up 8 rigs from last week to 26
2020, July, 10, 11:40:00
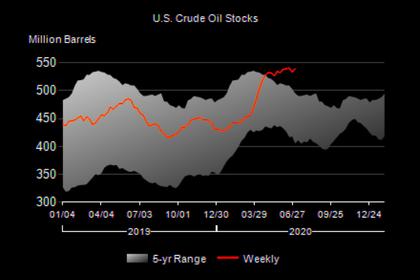
U.S. OIL INVENTORIES UP BY 5.7 MB TO 539.2 MB
U.S. commercial crude oil increased by 5.7 million barrels from the previous week to 539.2 million barrels.

2020, July, 3, 11:00:00
U.S. RIGS DOWN 2 TO 263
U.S. Rig Count is down 2 rigs from last week to 263, Canada Rig Count is up 5 rigs from last week to 18
2020, July, 2, 11:50:00
U.S. OIL INVENTORIES DOWN BY 7.2 MB TO 533.5 MB
U.S. commercial crude oil inventories decreased by 7.2 million barrels from the previous week.
2020, July, 2, 11:45:00
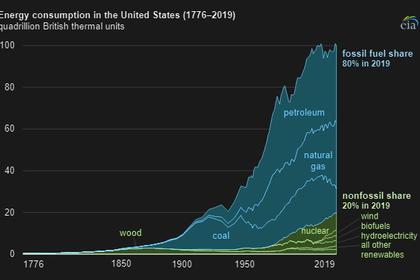
U.S. NONFOSSIL SOURCES: 20%
About 20% of U.S. energy consumption in 2019 came from sources other than fossil fuels


