2020-07-14 13:10:00
U.S. PRODUCTION: OIL (-56) TBD, GAS (-712) MCFD
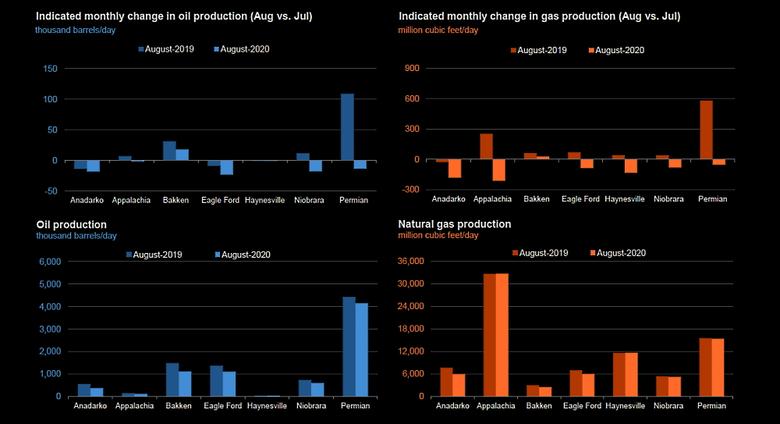
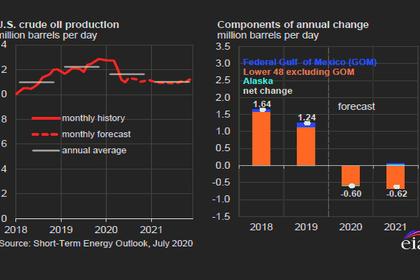
U.S. EIA - July 13, 2020 - Crude oil production from the major US onshore regions is forecast to decrease 56,000 b/d month-over-month in July from 7,546 to 7,490 thousand barrels/day, gas production to decrease 712 million cubic feet/day from 80,266 to 79,554 million cubic feet/day .
| Oil production thousand barrels/day | Gas production million cubic feet/day | |||||
|---|---|---|---|---|---|---|
| Region | July 2020 | August 2020 | change | July 2020 | August 2020 | change |
| Anadarko | 391 | 373 | (18) | 6,159 | 5,978 | (181) |
| Appalachia | 116 | 115 | (1) | 32,923 | 32,713 | (210) |
| Bakken | 1,095 | 1,113 | 18 | 2,485 | 2,514 | 29 |
| Eagle Ford | 1,129 | 1,106 | (23) | 6,102 | 6,017 | (85) |
| Haynesville | 37 | 36 | (1) | 11,802 | 11,669 | (133) |
| Niobrara | 618 | 600 | (18) | 5,352 | 5,272 | (80) |
| Permian | 4,160 | 4,147 | (13) | 15,443 | 15,391 | (52) |
| Total | 7,546 | 7,490 | (56) | 80,266 | 79,554 |
(712) |
| New-well oil production per rig barrels/day | New-well gas production per rig thousand cubic feet/day | |||||
|---|---|---|---|---|---|---|
| Region | July 2020 | August 2020 | change | July 2020 | August 2020 | change |
| Anadarko | 1,001 | 1,401 | 400 | 5,700 | 7,694 | 1,994 |
| Appalachia | 151 | 154 | 3 | 20,323 | 20,750 | 427 |
| Bakken | 1,385 | 2,147 | 762 | 2,304 | 3,570 | 1,266 |
| Eagle Ford | 1,789 | 2,416 | 627 | 6,184 | 8,348 | 2,164 |
| Haynesville | 23 | 23 | - | 10,792 | 10,803 | 11 |
| Niobrara | 1,460 | 1,971 | 511 | 4,817 | 5,685 | 868 |
| Permian | 824 | 964 | 140 | 1,624 | 1,867 | 243 |
| Rig-weighted average | 805 | 904 | 99 | 5,474 | 6,659 | 1,185 |
| Drilled but uncompleted wells (DUC) wells |
||||
| Region | May 2020 | June 2020 | change | |
| Anadarko | 717 | 710 | (7) | |
| Appalachia | 579 | 568 | (11) | |
| Bakken | 875 | 882 | 7 | |
| Eagle Ford | 1,301 | 1,295 | (6) | |
| Haynesville | 263 | 264 | 1 | |
| Niobrara | 450 | 452 | 2 | |
| Permian | 3,439 | 3,488 | 49 | |
| Total | 7,624 | 7,659 | 35 | |
-----
Earlier:
2020, July, 10, 11:40:00
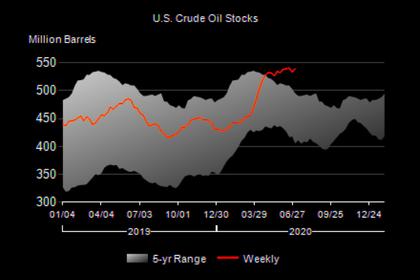
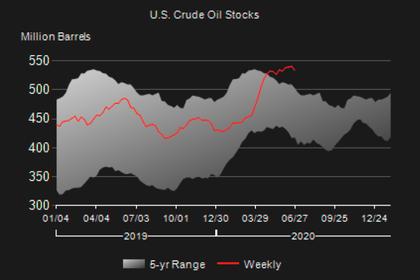
U.S. OIL INVENTORIES UP BY 5.7 MB TO 539.2 MB
U.S. commercial crude oil increased by 5.7 million barrels from the previous week to 539.2 million barrels.
2020, July, 10, 11:35:00
U.S. SHALE: NO TARGET
The intervention of the United States, the G-20 and other leading producing countries was vital in securing April’s historic production deal to rebalance and stabilize oil markets reeling from the pandemic.
2020, July, 6, 10:55:00
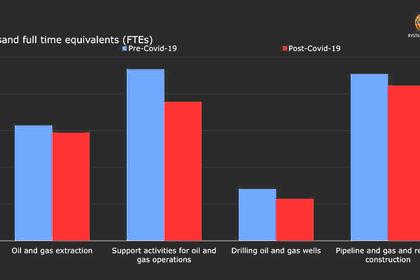
U.S. ENERGY LOOSES
U.S. oil and gas extraction businesses shed 1,200 jobs last month.

2020, July, 3, 11:00:00
U.S. RIGS DOWN 2 TO 263
U.S. Rig Count is down 2 rigs from last week to 263, Canada Rig Count is up 5 rigs from last week to 18
2020, July, 2, 11:50:00
U.S. OIL INVENTORIES DOWN BY 7.2 MB TO 533.5 MB
U.S. commercial crude oil inventories decreased by 7.2 million barrels from the previous week.
2020, July, 2, 11:45:00
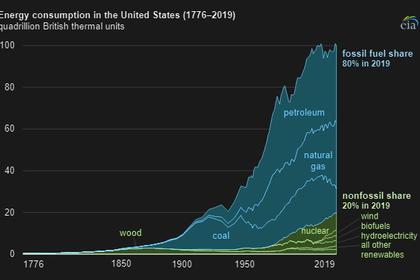
U.S. NONFOSSIL SOURCES: 20%
About 20% of U.S. energy consumption in 2019 came from sources other than fossil fuels


