2020-08-13 13:40:00


OIL PRICES 2020-21: $43-$50
U.S. EIA - August 11, 2020 - SHORT-TERM ENERGY OUTLOOK
Forecast Highlights
- The August Short-Term Energy Outlook (STEO) remains subject to heightened levels of uncertainty because mitigation and reopening efforts related to the 2019 novel coronavirus disease (COVID-19) continue to evolve. Reduced economic activity related to the COVID-19 pandemic has caused changes in energy demand and supply patterns in 2020. Uncertainties persist across the U.S. Energy Information Administration’s (EIA) outlook for all energy sources, including liquid fuels, natural gas, electricity, coal, and renewables. The STEO is based on U.S. macroeconomic forecasts by IHS Markit, which assume U.S. gross domestic product declined by 5.2% in the first half of 2020 from the same period a year ago and will rise from the third quarter of 2020 through 2021.
- Daily Brent crude oil spot prices averaged $43 per barrel (b) in July, up $3/b from the average in June and up $25/b from the multiyear low monthly average price in April. EIA expects monthly Brent spot prices will average $43/b during the second half of 2020 and rise to an average of $50/b in 2021.
- U.S. regular gasoline retail prices averaged $2.18 per gallon (gal) in July, an increase of 10 cents/gal from the average in June but 56 cents/gal lower than at the same time last year. EIA expects that gasoline prices will gradually decrease through the rest of the summer to reach an average of $2.04/gal in September before falling to an average of $1.99/gal in the fourth quarter. Forecast U.S. regular gasoline retail prices will average $2.23/gal in 2021, compared with an average of $2.12/gal in 2020.
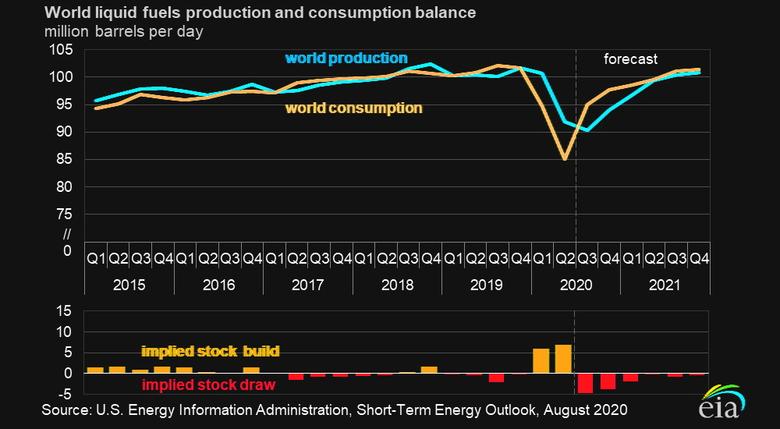
- EIA expects high inventory levels and surplus crude oil production capacity will limit upward price pressures in the coming months, but as inventories decline into 2021, those upward price pressures will increase. EIA estimates global liquid fuels inventories rose at a rate of 6.4 million barrels per day (b/d) in the first half of 2020 and expects they will decline at a rate of 4.2 million b/d in the second half of 2020 and then decline by 0.8 million b/d in 2021.
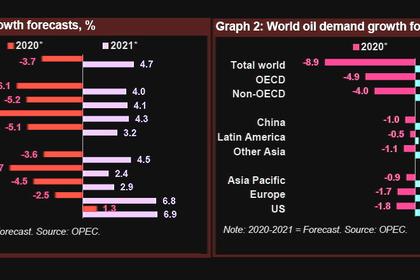
- EIA estimates that demand for global petroleum and liquid fuels averaged 93.4 million b/d in July. Demand was down 9.1 million b/d from July 2019, but it was up from an average of 85.0 million b/d during the second quarter of 2020, which was down 15.8 million b/d from year-ago levels. EIA forecasts that consumption of petroleum and liquid fuels globally will average 93.1 million b/d for all of 2020, down 8.1 million b/d from 2019, before increasing by 7.0 million b/d in 2021. Reduced economic activity related to the COVID-19 pandemic has caused changes in energy supply and demand patterns in 2020.
- EIA estimates that global liquid fuels production averaged 91.8 million b/d in the second quarter of 2020, down 8.6 million b/d year over year. The decline reflects voluntary production cuts by the Organization of the Petroleum Exporting Countries (OPEC) and partner countries (OPEC+), and reductions in drilling activity and production curtailments in the United States because of low oil prices. In the forecast, the global supply of oil continues to decline to 90.4 million b/d in the third quarter of 2020 before rising to an annual average of 99.4 million b/d in 2021.
- EIA estimates that U.S. liquid fuels consumption averaged 16.2 million b/d in the second quarter of 2020, down 4.1 million b/d (20%) from the same period in 2019. The decline reflects travel restrictions and reduced economic activity related to COVID-19 mitigation efforts. EIA expects U.S. oil consumption will generally rise through the end of 2021. EIA forecasts U.S. liquid fuels consumption will average 18.9 million b/d in the third quarter of 2020 (down 1.8 million b/d year over year) before rising to an average of 20.0 million b/d in 2021. Although the 2021 forecast level is 1.6 million b/d more than EIA’s forecast 2020 consumption, it is 0.4 million b/d less than the 2019 average.
- EIA has lowered U.S. crude oil production estimates for 2020 by 370,000 b/d from the previous STEO. EIA expects crude production to average 11.3 million b/d in 2020 and 11.1 million b/d in 2021, down from 12.2 million b/d in 2019. Recently released EIA data show that average monthly U.S. oil production for May was 1.2 million b/d lower than the July STEO forecast, indicating more extensive production curtailments than previously estimated. Also, EIA’s August STEO assumes that the Dakota Access Pipeline will remain operational. A U.S. District Court ordered on July 6 the temporary closure of the Dakota Access Pipeline beginning in early August. A U.S. appeals court has overturned the lower court decision, allowing the pipeline to remain running while further litigation proceedings continue.
- In July, the Henry Hub natural gas spot price averaged $1.77 per million British thermal units (MMBtu). EIA expects natural gas prices will generally rise through the end of 2021 but the sharpest increases will be during this fall and winter when they rise from an average of $2.11/MMBtu in September to $3.14/MMBtu in February. EIA expects that rising demand heading into winter, combined with reduced production, will cause upward price pressures. EIA forecasts that Henry Hub natural gas spot prices will average $2.03/MMBtu in 2020 and $3.14/MMBtu in 2021.
- EIA estimates that total U.S. working natural gas in storage ended July at about 3.3 trillion cubic feet (Tcf), 15% more than the five-year (2015–19) average. In the forecast, inventories rise by 2.0 Tcf during the April-through-October injection season to reach nearly 4.0 Tcf on October 31.
- EIA expects that total U.S. consumption of natural gas will average 82.4 billion cubic feet per day (Bcf/d) in 2020, down 3.0% from 2019. The largest decline in consumption occurs in the industrial sector, which EIA forecasts will average 22.0 Bcf/d in 2020, down 1.0 Bcf/d from 2019, as a result of reduced manufacturing activity. The decline in total U.S. consumption also reflects lower heating demand in early 2020, contributing to residential and commercial demand in 2020 averaging 12.8 Bcf/d (down 0.9 Bcf/d from 2019) and 8.8 Bcf/d (down 0.8 Bcf/d from 2019), respectively.
- U.S. dry natural gas production set an annual record in 2019, averaging 92.2 Bcf/d. EIA forecasts dry natural gas production will average 88.7 Bcf/d in 2020, with monthly production falling from its monthly average peak of 96.2 Bcf/d in November 2019 to 82.7 Bcf/d by April 2021, before increasing slightly. Natural gas production declines the most in the Permian region, where EIA expects low crude oil prices will reduce associated natural gas output from oil-directed rigs. EIA’s forecast of dry natural gas production in the United States averages 84.0 Bcf/d in 2021. EIA expects production to begin rising in the second quarter of 2021 in response to higher natural gas and crude oil prices.
- EIA estimates that U.S. liquefied natural gas (LNG) exports will average 5.5 Bcf/d in 2020 and will average 7.3 Bcf/d in 2021. EIA expects that U.S. LNG exports will decline through the end of the summer as a result of reduced global demand for natural gas. U.S. exports of LNG in July 2020 averaged 3.1 Bcf/d, which is about the same as in May 2018, when the available liquefaction capacity was about one-third of the current capacity. Declines in global natural gas demand associated with COVID-19 mitigation efforts, high natural gas storage inventories in Europe and Asia, and an on-going expansion in LNG liquefaction capacity have contributed to natural gas and LNG prices reaching all-time historical lows. Low international prices have affected the economic competitiveness of U.S. LNG exports and have led to numerous cargo cancellations, particularly at the Sabine Pass, Corpus Christi, and Freeport LNG export terminals. EIA expects LNG exports from the United States to remain low in the next few months. Based on numerous trade press reports, EIA estimates about 45 cargoes have been canceled for upcoming August shipments and about 30 cargoes have been canceled for September shipments.
- EIA forecasts 3.6% less electricity consumption in the United States in 2020 compared with 2019. The largest decline on a percentage basis is in the commercial sector, where EIA expects retail sales of electricity to fall by 7.4% this year. Forecast industrial retail electricity sales fall by 5.8%. EIA forecasts residential sector retail sales will increase by 2.0% in 2020. Milder winter temperatures earlier in the year led to lower consumption for space heating, but that factor is offset by increased summer cooling demand and an assumed increase in electricity use by more people working from home. In 2021, EIA forecasts total U.S. electricity consumption will rise by 0.8%.
- EIA expects the share of U.S. electric power sector generation from natural gas-fired power plants will increase from 37% in 2019 to 40% this year. In 2021, the forecast natural gas share declines to 35% in response to higher natural gas prices. Coal’s forecast share of electricity generation falls from 24% in 2019 to 18% in 2020 and then increases to 22% in 2021. Electricity generation from renewable energy sources rises from 17% in 2019 to 20% in 2020 and to 22% in 2021. The increase in the share from renewables is the result of expected additions to wind and solar generating capacity. EIA expects a decline in nuclear generation in both 2020 and 2021, reflecting recent and upcoming retirements of nuclear generating capacity.
- EIA forecasts that renewable energy will be the fastest-growing source of electricity generation in 2020. EIA expects the electric power sector will add 23.2 gigawatts (GW) of new wind capacity and 12.9 GW of utility-scale solar capacity in 2020. However, these future capacity additions are subject to a high degree of uncertainty, and EIA continues to monitor reported planned capacity builds.
- U.S. coal consumption, which dropped to its lowest point since April, totaled 95 MMst in the second quarter of 2020. EIA expects coal consumption to rise to a seasonal peak of 127 MMst in the third quarter but remain lower than 2019 levels through the end of 2020. EIA estimates that U.S. coal consumption will decrease by 26% in 2020 and increase by 20% in 2021. EIA estimates that total U.S. coal production in 2020 will decrease by 29% from 2019 levels to 502 MMst. In 2021, EIA expects higher demand and rising natural gas prices to a lead to a recovery in coal production of 12%, with a total annual production level of 564 MMst.
- EIA forecasts that U.S. energy-related carbon dioxide (CO2) emissions, after decreasing by 2.8% in 2019, will decrease by 11.5% (588 million metric tons) in 2020. This record decline is the result of less energy consumption related to restrictions on business and travel activity and slowing economic growth related to COVID-19 mitigation efforts. CO2 emissions decline with reduced consumption of all fossil fuels, particularly coal (24.9%) and petroleum (11.6%). In 2021, EIA forecasts that energy-related CO2 emissions will increase by 5.6%, as the economy recovers and stay-at-home orders are lifted. Energy-related CO2 emissions are sensitive to changes in weather, economic growth, energy prices, and fuel mix.
-----
Earlier:

2020, August, 12, 14:20:00
OIL PRICE: ABOVE $45 ANEW
Brent was up 67 cents, or 1.5%, at $45.17 a barrel, WTI was up 65 cents, or 1.6%, at $42.26 a barrel

2020, August, 12, 14:00:00
U.S. FRACKING IS IMPORTANT
A ban on fracking may sound noble in some circles, but far from being a practical and permanent solution, it may pose significant impediments to energy generation in the United States and the national economy.
2020, August, 10, 11:25:00
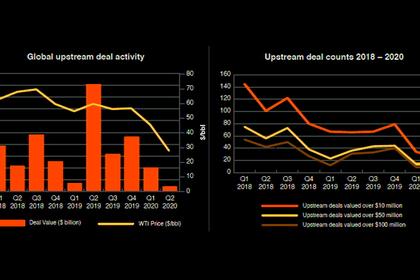
OIL, GAS M&A
The top country in terms of M&A deals activity in Q2 2020 was the US with 83 deals, followed by China with 33 and Canada with 21.
2020, August, 5, 12:10:00
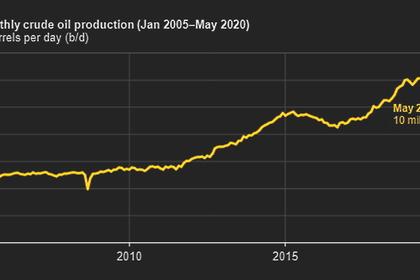
U.S. OIL PRODUCTION DECREASING
Production of crude oil decreased in the United States in May 2020 by 1.99 million barrels per day (b/d)
2020, July, 30, 12:15:00
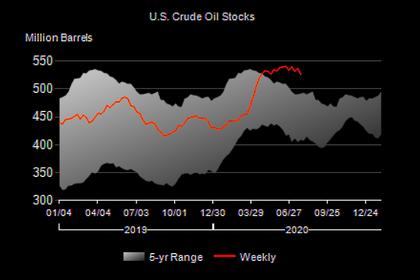
U.S. OIL INVENTORIES DOWN BY 10.6 MB TO 526.0 MB
U.S. commercial crude oil inventories decreased by 10.6 million barrels from the previous week to 526.0 million barrels,
2020, July, 15, 14:15:00
OIL DEMAND WILL UP
In 2021, oil demand is forecast to partially recover from the current year to show historic high growth of 7.0 mb/d.
2020, July, 14, 13:10:00
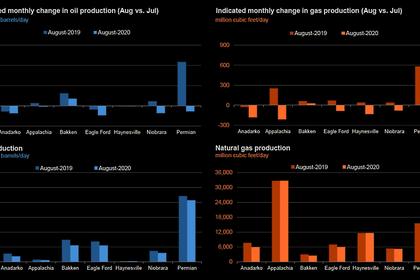
U.S. PRODUCTION: OIL (-56) TBD, GAS (-712) MCFD
Crude oil production from the major US onshore regions is forecast to decrease 56,000 b/d month-over-month in July from 7,546 to 7,490 thousand barrels/day, gas production to decrease 712 million cubic feet/day from 80,266 to 79,554 million cubic feet/day .


