2020-08-17 12:30:00


U.S. INDUSTRIAL PRODUCTION UP
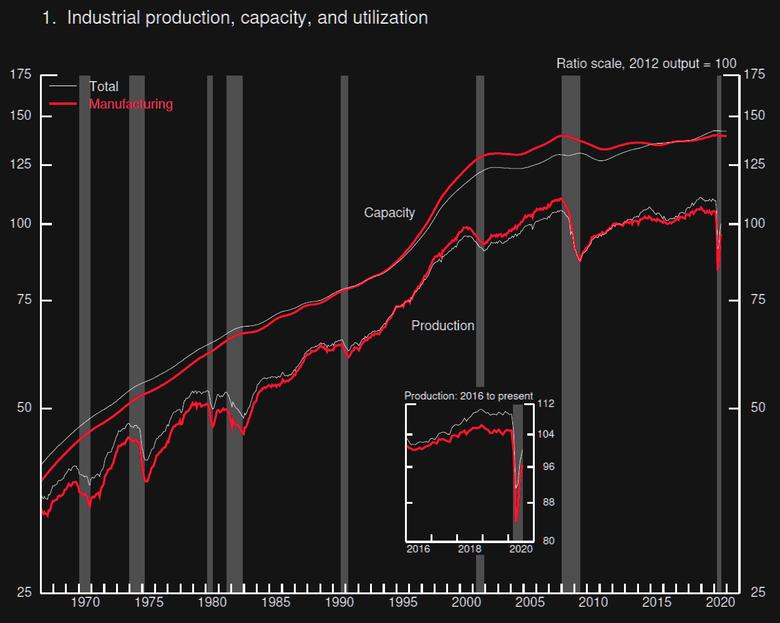
U.S. FRB - August 14, 2020 - Total industrial production rose 3.0 percent in July after increasing 5.7 percent in June; even so, the index in July was 8.4 percent below its pre-pandemic February level. Manufacturing output continued to improve in July, rising 3.4 percent. Most major industries posted increases, though they were much smaller in magnitude than the advances recorded in June. The largest gain in July—28.3 percent—was registered by motor vehicles and parts; factory production elsewhere advanced 1.6 percent. Mining production rose 0.8 percent after decreasing for five consecutive months. The output of utilities increased 3.3 percent, as unusually warm temperatures increased the demand for air conditioning. At 100.2 percent of its 2012 average, the level of total industrial production was 8.2 percent lower in July than it was a year earlier. Capacity utilization for the industrial sector increased 2.1 percentage points in July to 70.6 percent, a rate that is 9.2 percentage points below its long-run (1972–2019) average but 6.4 percentage points above its low in April.


Market Groups
The indexes for all of the major market groups advanced in July, though by less than in June. The strength in motor vehicles contributed to increases in the indexes for consumer durables (14.6 percent), business equipment (5.0 percent), and durable materials (3.7 percent). Consumer energy products, business supplies, and defense and space equipment also posted gains of more than 2 percent.
Industry Groups
Manufacturing output increased 3.4 percent in July, but it was still about 8 percent below its pre-pandemic February level. The index for durable manufacturing rose 5.5 percent in July. In addition to the large advance for motor vehicles and parts, increases of more than 6 percent were recorded by aerospace and miscellaneous transportation equipment and by miscellaneous manufacturing. Substantial gains in the past three months have pushed the output of motor vehicles and parts to nearly its February level. The index for nondurables rose 1.3 percent in July, with gains of more than 3 percent for textile and product mills, for printing and support, and for petroleum and coal products. The output of other manufacturing (publishing and logging) increased 1.5 percent.
The output of utilities rose 3.3 percent in July, largely reflecting strength in electric utilities. Mining output increased 0.8 percent. Gains were concentrated primarily in crude oil extraction and coal mining but also were recorded by most other types of mining. In contrast, the index for oil and gas well drilling fell 8.0 percent and was about 70 percent below its year-earlier level.
Capacity utilization for manufacturing was 69.2 percent in July, 9.2 percentage points higher than its trough in April and 5.5 percentage points above its recession trough of June 2009. The operating rates for durable and nondurable manufacturing increased to 68.1 percent and 71.5 percent, respectively. The rate for durables was about 14 percentage points above its April low but still about 7 percentage points below its pre-pandemic February level; the rate for nondurables has risen 4.2 percentage points since April but was still about 5 percentage points below February. The operating rate for mining rose to 73.5 percent in July. However, a downward revision to crude oil extraction in May left the utilization rates for mining in May, June, and July lower than any previous rates in the history of the series (since 1967).
-----
Earlier:

2020, August, 13, 13:30:00
U.S. BUDGET DEFICIT $2.81 TLN
The U.S. budget deficit climbed to $2.81 trillion in the first 10 months of the budget year,
2020, August, 6, 11:45:00
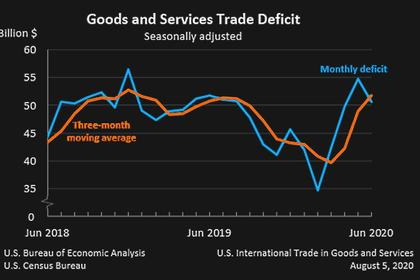
U.S. INTERNATIONAL TRADE DEFICIT $50.7 BLN
The U.S. goods and services deficit was $50.7 billion in June
2020, August, 3, 12:40:00
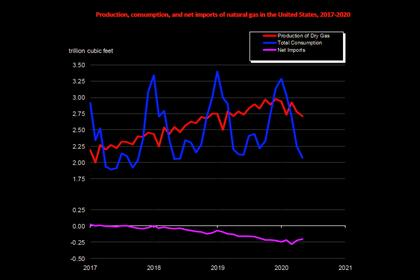
U.S. GAS PRODUCTION DOWN
The U.S. preliminary level for dry natural gas production in May 2020 was 2,713 billion cubic feet (Bcf), or 87.5 Bcf/d.
2020, August, 3, 12:15:00
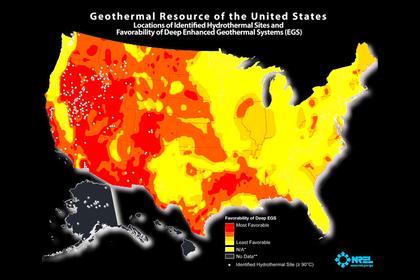
U.S. GEOTHERMAL ENERGY DEVELOPMENT
the U.S. Department of Energy (DOE) announced that five projects will receive up to $28 million to promote the advancement of the next generation of geothermal energy technologies.
2020, July, 31, 10:20:00
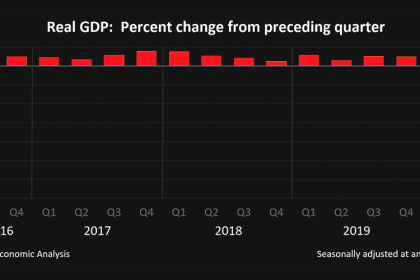
U.S. GDP DOWN
U.S. real gross domestic product (GDP) decreased at an annual rate of 32.9 percent in the second quarter of 2020
2020, July, 30, 12:20:00
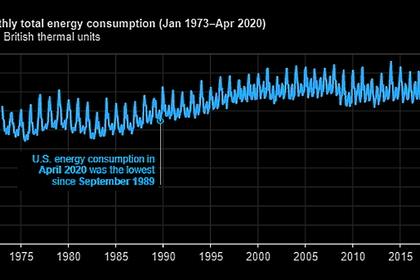
U.S. ENERGY CONSUMPTION DOWN
the United States consumed 6.5 quadrillion British thermal units of energy in April 2020,
2020, July, 30, 11:50:00
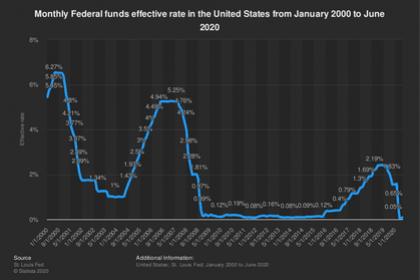
U.S. FEDERAL FUNDS RATE 0-0.25% AGAIN
the Committee decided to maintain the target range for the federal funds rate at 0 to 1/4 percent.

