2020-08-14 11:55:00


U.S. LNG EXPORTS DOWN
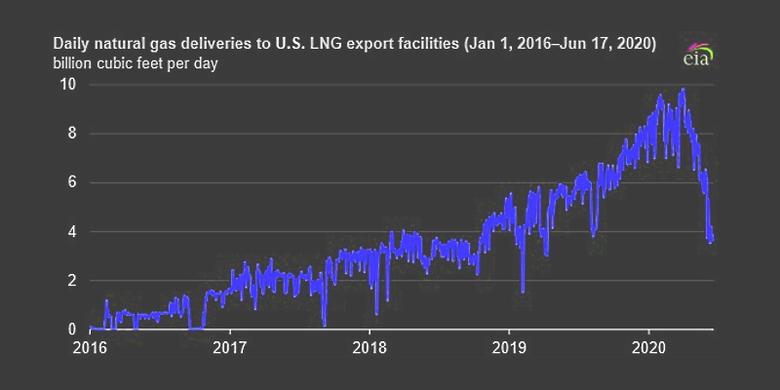
GASPROCESSING - August 12, 2020 - After establishing a record high of 8.0 billion cubic feet per day (Bcf/d) in January 2020, U.S. exports of LNG fell to an average of 3.1 Bcf/d in July 2020. July exports were similar to LNG exports in May 2018, when the available liquefaction capacity was about one-third of the current capacity.
During the week of July 12–18, 2020, LNG weekly exports were loaded by only four vessels for a total of 2.0 Bcf/d—the same levels as the second week of December 2016. The U.S. Energy Information Administration (EIA) expects U.S. LNG exports to remain at low levels for the next few months. According to trade press reports, 45 cargoes have been canceled for August shipments and an estimated 30 cargoes have been canceled for September shipments.
Global natural gas demand has declined in response to COVID-19 mitigation efforts. High natural gas storage inventories in Europe and Asia and an ongoing expansion of global LNG liquefaction capacity have also contributed to international natural gas and LNG prices reaching all-time historical lows. Because most U.S. LNG exports are traded in the global spot market, low global spot and forward prices for natural gas and LNG made exports from the United States uneconomical.
Based on the number of cargoes loaded in June and July and the available liquefaction capacity in operation, EIA estimates that about 46 cargoes were canceled in June and about 50 cargoes were canceled in July 2020, exceeding the reported number of expected cancelations in both months. The most affected LNG terminals were Sabine Pass in Louisiana and Corpus Christi and Freeport in Texas, where the utilization of liquefaction capacity in July averaged 33%, 28%, and 6%, respectively.
Since U.S. LNG export capacity ramped up in 2018, capacity utilization in the summer has averaged more than 90% because of more weather-related LNG demand in the northern hemisphere, which consumes 98% of global LNG. This summer, EIA forecasts that utilization at U.S. LNG liquefaction facilities will average 35%, or similar to utilization in off-peak months (April, May, September, and October) when seasonal demand tends to be at its lowest level.
Global LNG consumption had record growth in 2018 and 2019, and it continued to expand through February 2020. LNG imports in Asia, which account for 70% of global LNG imports, declined to last year's levels by June, mostly as a result of declines in Japan and South Korea. After record growth in the past two years, LNG imports in Europe have also declined because of lower natural gas demand and high levels of natural gas in storage following a mild winter. European natural gas storage levels were 85% full at the end of July 2020. Natural gas demand in key European import markets remains depressed, limiting additional LNG imports in the coming months.
Global LNG suppliers have reduced shipments in response to a decline in global LNG demand. In June and July of this year, Australia and the United States, the world's second- and third-largest LNG exporting countries, reduced LNG exports the most among LNG producers—by an average 1.2 Bcf/d and 1.5 Bcf/d, respectively. Russia, the world's fourth-largest LNG exporter, reduced LNG shipments by an average 0.9 Bcf/d (25%) in June and July of this year compared with the same period last year. Qatar, the world's largest LNG exporter, reduced LNG exports by an average 0.5 Bcf/d in June and July of 2020 compared with the same period last year, while its LNG exports in other months of this year remained relatively unchanged compared with last year.
In the August Short-Term Energy Outlook, EIA forecasts that U.S. LNG exports will return to pre-COVID levels by November 2020 and remain relatively high (at about 8 Bcf/d–9 Bcf/d) through this coming winter and into 2021.
-----
Earlier:
2020, August, 12, 14:15:00
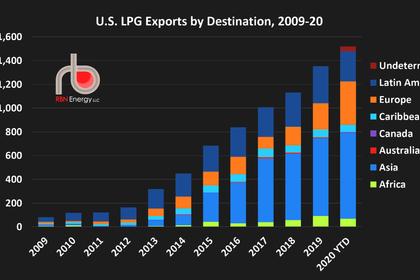
U.S. LPG FOR ASIA UP
LPG demand from China and Indian is showing initial signs of recovery, while Indonesia is seeking term cargoes.
2020, August, 12, 14:00:00
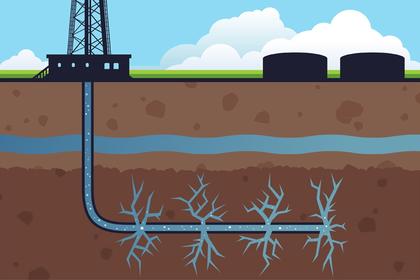
U.S. FRACKING IS IMPORTANT
A ban on fracking may sound noble in some circles, but far from being a practical and permanent solution, it may pose significant impediments to energy generation in the United States and the national economy.
2020, August, 3, 12:40:00
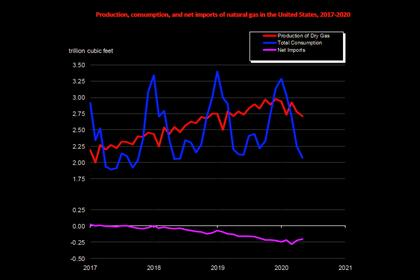
U.S. GAS PRODUCTION DOWN
The U.S. preliminary level for dry natural gas production in May 2020 was 2,713 billion cubic feet (Bcf), or 87.5 Bcf/d.
2020, July, 30, 12:20:00
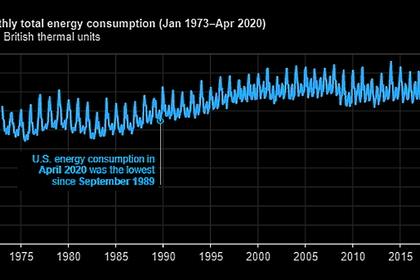
U.S. ENERGY CONSUMPTION DOWN
the United States consumed 6.5 quadrillion British thermal units of energy in April 2020,
2020, July, 27, 16:15:00
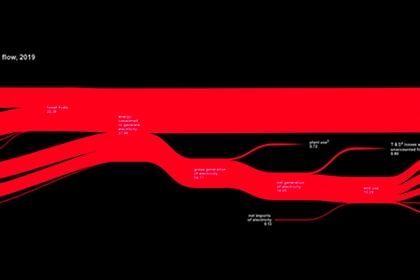
U.S. ENERGY CONVERSION LOSS
U.S. utility-scale generation facilities consumed 38 quadrillion British thermal units (quads) of energy to provide 14 quads of electricity.
2020, July, 27, 15:45:00
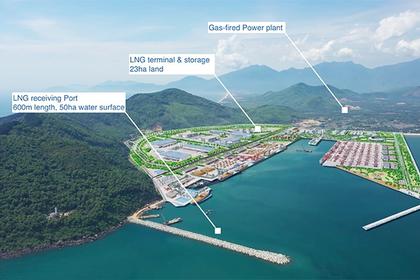
U.S., VIETNAM LNG INVESTMENT $6.2 BLN
The Vietnam's government expects the country to face power shortages in the future
2020, July, 14, 13:10:00
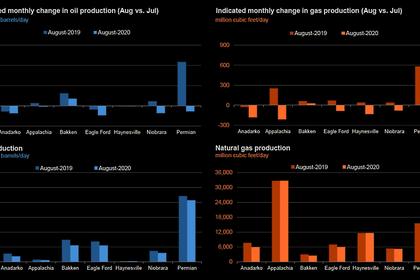
U.S. PRODUCTION: OIL (-56) TBD, GAS (-712) MCFD
Crude oil production from the major US onshore regions is forecast to decrease 56,000 b/d month-over-month in July from 7,546 to 7,490 thousand barrels/day, gas production to decrease 712 million cubic feet/day from 80,266 to 79,554 million cubic feet/day .


