2020-09-22 13:10:00


U.S. DRILLING: THE LOWEST
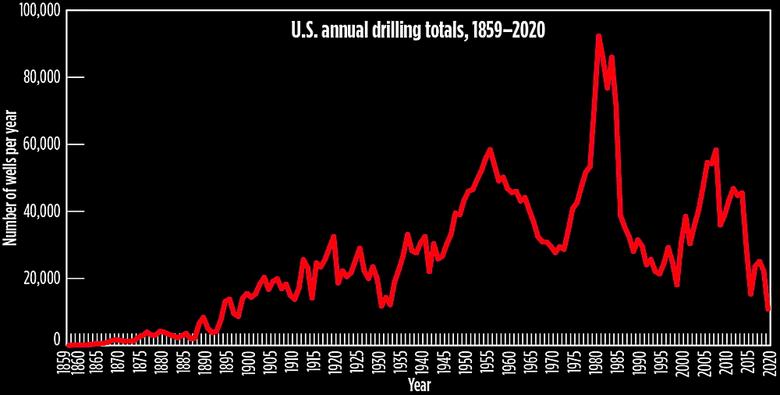
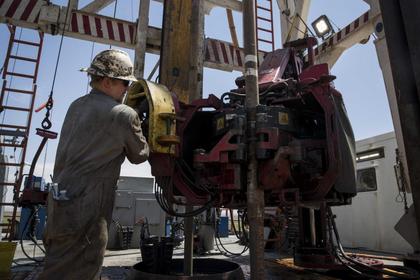
WO - 9/21/2020 - At World Oil, we have finished compiling the 2020 mid-year forecast update for drilling and production. On the drilling side, we now can tell you, our readers, that if this forecast is realized, the U.S. total for the year will definitely be the lowest since before 1940. Indeed, it could go back considerably further than the 1930s. One can see the history of U.S. drilling, as shown in the accompanying chart, all the way back to 1859.
The historical basis. But first, operators will have to drill at a pace lower than those of 1933 and 1931, when well totals of 12,170 and 11,716, respectively, were tallied. The fact that we are looking at a level potentially below these two years—below 11,000 wells—is quite historical, albeit remarkably negative. And consider the fact that just last year, we estimate that somewhat over 22,000 wells were drilled, and in 2018, the number is estimated at approximately 25,000. By the same token, it wasn't but six years ago, in 2014, that the U.S. well total was 45,535. There has not been an annual total above 30,000 since then.
Trends behind the performance. This year's trend toward a total that may be below 11,000 should come as no surprise to anyone, who has been following oil market trends since early February. In the seven months that have followed, the U.S. market has been hit by a record, quick, oil demand reduction prompted by the coronavirus pandemic; the Saudi-Russian dispute over production quotas that exacerbated the effect of the demand reduction; operators' quick response to low prices that ensued, including shutting-in wells and reducing or halting drilling; and a slower-than-expected recovery from the pandemic in the U.S. economy.
Operator responses to low prices and demand. To be more specific about operator activity, World Oil has received dozens of survey responses from producers, which have cut back their drilling from first-quarter 2020 levels, not just substantially but actually quite drastically. A number of companies said that in the second half of the year, they are drilling half, or less than half, of the number of wells that they drilled in the first half. So, imagine that an operator might have drilled 100 wells in the first half and will only drill 40 in the second half. Or maybe a firm drilled 65 wells in the first half and plans only 20 in the second half. These figures are NOT any one company's actual numbers, but they are representative of the types of data that we have been receiving.
Furthermore, one should remember that 2019 was not the greatest drilling year to begin with, and first-quarter drilling by most operators was roughly on a par with that year's pace. But since then, drilling has gone off the cliff. There were substantial reductions during second-quarter 2020, including some companies that went on a drilling hiatus. These reductions have been carried through, into the third quarter, with a few that are even deeper than in the second quarter. We expect a mild pick-up in U.S. drilling during the fourth quarter, and our forecast has that expectation baked into it. So, if that pickup does not occur, then the final 2020 number will be even lower, accordingly.
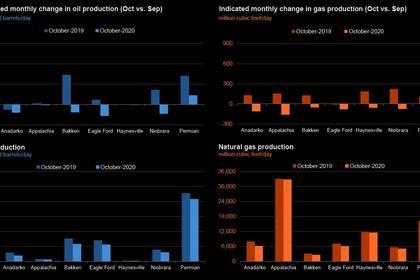
Regional effects. To no one's surprise, the greatest effects of the drilling trough are being felt in the various U.S. shale plays, such as the Permian, Eagle Ford, Bakken and Niobrara, where oil activity has been dominant. However, while they have experienced double-digit declines in drilling, the gas prone Marcellus, Haynesville and Utica (which does have an oil component) shales have not experienced reductions in the magnitude of the oil-prone plays. And there are a few bright spots in some of the more minor states, where traditional, vertical, sometimes-shallow oil activity is more prevalent and will actually have minor increases.
World Oil will release its final, official mid-year forecast (including the expected U.S. drilling total) in the September issue, which will be out shortly.
-----
Earlier:

2020, September, 21, 12:25:00
U.S. GAS DELIVERIES UP
Gas deliveries to the five other major US liquefaction terminals besides Cameron LNG totaled 8.04 Bcf/d
2020, September, 21, 11:45:00
U.S. RIGS UP 1 TO 255
U.S. Rig Count is up 1 from last week to 255, Canada Rig Count is up 12 from last week to 64
2020, September, 15, 16:30:00
U.S. PRODUCTION: OIL (-68) TBD, GAS (-428) MCFD
Crude oil production from the major US onshore regions is forecast to decrease 68,000 b/d month-over-month in September from 7,708 to 7,640 thousand barrels/day, gas production to decrease 428 million cubic feet/day from 81,026 to 80,598 million cubic feet/day .
2020, September, 15, 16:25:00
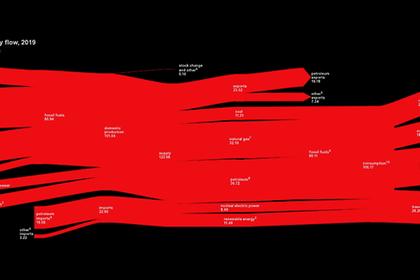
U.S. FOSSIL FUELS 80%
In 2019, 80% of U.S. domestic energy production was from fossil fuels, and 80% of domestic energy consumption originated from fossil fuels.
2020, September, 7, 10:45:00
U.S. RIGS UP 2 TO 256
U.S. Rig Count is up 2 from last week to 256, Canada Rig Count is down 2 rigs from last week to 52
2020, September, 3, 12:45:00
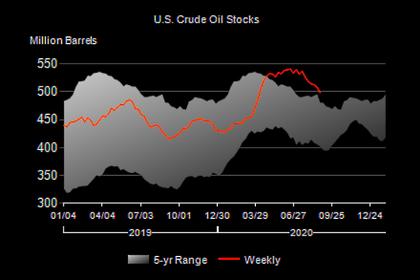
U.S. OIL INVENTORIES DOWN BY 9.4 MB TO 498.4 MB
U.S. commercial crude oil inventories decreased by 9.4 million barrels to 498.4 million barrels,
2020, September, 1, 15:00:00
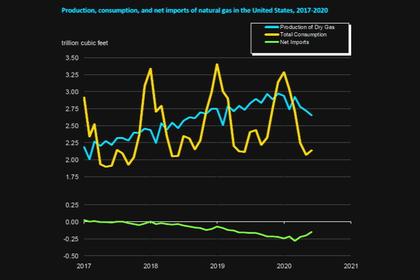
U.S. GAS PRODUCTION DOWN ANEW
The preliminary level for U.S. dry natural gas production in June 2020 was 2,650 billion cubic feet (Bcf), or 88.3 Bcf/d.


