2020-09-25 13:15:00


U.S. GAS CONSUMPTION DOWN
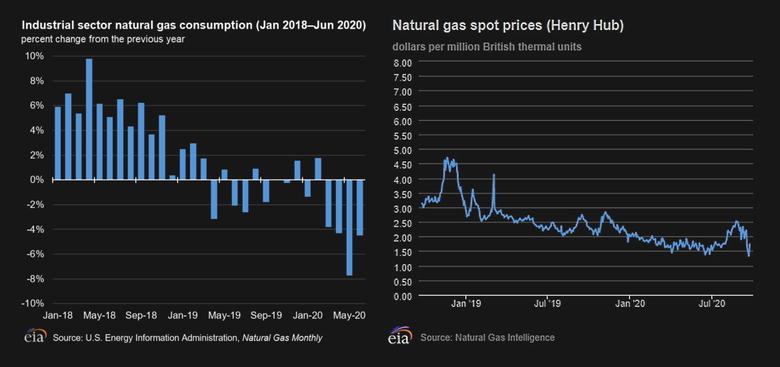
U.S. EIA - September 24, 2020 - Natural gas consumption in the U.S. industrial sector declined from 25.4 billion cubic feet per day (Bcf/d) in January 2020 to 20.1 Bcf/d in June 2020, according to the U.S. Energy Information Administration’s (EIA) Natural Gas Monthly. Industrial natural gas consumption in June 2020 was nearly 1.0 Bcf/d lower than its year-ago level. The decline in industrial sector natural gas consumption compared with the previous year began in March 2020, amid responses to the coronavirus disease (COVID-19) that resulted in a global economic slowdown. Industrial sector consumption reached its lowest point in May 2020, falling by 8% compared with 2019 levels. May 2020 consumption of natural gas by U.S. industry marked the largest year-over-year decline since July 2009, during the 2007–2009 recession. Before this year, average U.S. industrial natural gas consumption grew 5.4% in 2018 and was relatively flat (growing 0.1%) in 2019.
Beginning in March 2020, efforts to mitigate COVID-19 began in the United States. Responses to the virus, including stay-at-home orders and temporary closings of nonessential businesses, contributed to a slowing U.S. economy. According to the Bureau of Economic Analysis (BEA), the value of goods and services produced in the United States, known as gross domestic product (GDP), decreased by 9.1% in the second quarter of 2020 compared with the same quarter a year ago. A slowing economy as a result of COVID-19 mitigation efforts also affected GDP in the first quarter of 2020, which grew 0.3%. Last year, the U.S. economy grew 2.2%.
According to the September 2020 Short-Term Energy Outlook, EIA expects annual consumption of natural gas by U.S. industries to decline by 4.4% in 2020 and then grow 1.1% in 2021. EIA forecasts U.S. industrial natural gas consumption to increase in 2021 because of expected growth in the overall economy and the natural gas-weighted industrial production index. The index reflects the growth of the underlying manufacturing subsectors and the relative importance of those subsectors to total natural gas consumption.
A recent Today in Energy article provides more information about recent industrial natural gas demand trends.
-----
Earlier:
2020, September, 21, 12:25:00
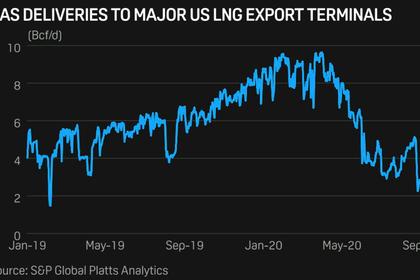
U.S. GAS DELIVERIES UP
Gas deliveries to the five other major US liquefaction terminals besides Cameron LNG totaled 8.04 Bcf/d
2020, September, 17, 16:45:00
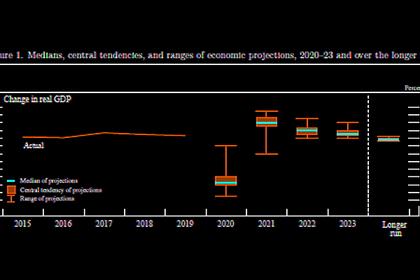
U.S. GDP WILL DOWN 3.7%
Federal Reserve Board and Federal Open Market Committee release economic projections from the September 15-16 FOMC meeting
2020, September, 16, 12:05:00
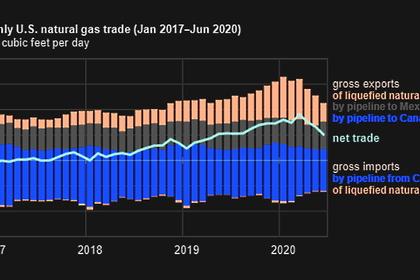
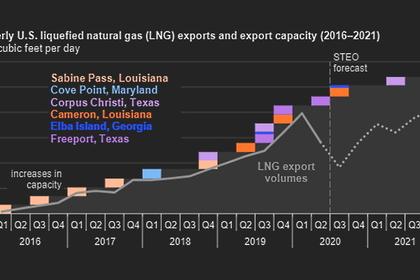
U.S. GAS EXPORTS DOWN
net natural gas exports to continue increasing in the coming months primarily because of increasing U.S. LNG exports.
2020, September, 16, 11:25:00
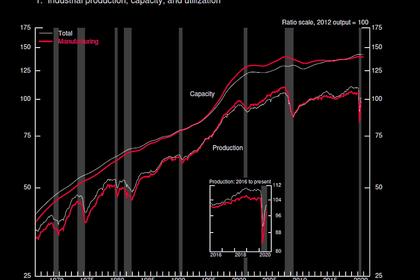
U.S. INDUSTRIAL PRODUCTION UP
U.S. industrial production rose 0.4 percent in August for its fourth consecutive monthly increase.
2020, September, 15, 16:30:00
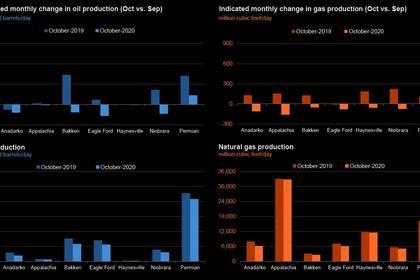
U.S. PRODUCTION: OIL (-68) TBD, GAS (-428) MCFD
Crude oil production from the major US onshore regions is forecast to decrease 68,000 b/d month-over-month in September from 7,708 to 7,640 thousand barrels/day, gas production to decrease 428 million cubic feet/day from 81,026 to 80,598 million cubic feet/day .
2020, September, 3, 12:35:00
U.S. LNG WILL UP
LNG became “the worst-performing global energy commodity” during the pandemic, the Institute for Energy Economics and Financial Analysis (IEEFA) said on July 29.
2020, September, 1, 15:00:00
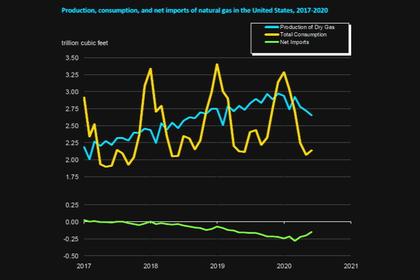
U.S. GAS PRODUCTION DOWN ANEW
The preliminary level for U.S. dry natural gas production in June 2020 was 2,650 billion cubic feet (Bcf), or 88.3 Bcf/d.


