2020-09-16 12:05:00


U.S. GAS EXPORTS DOWN
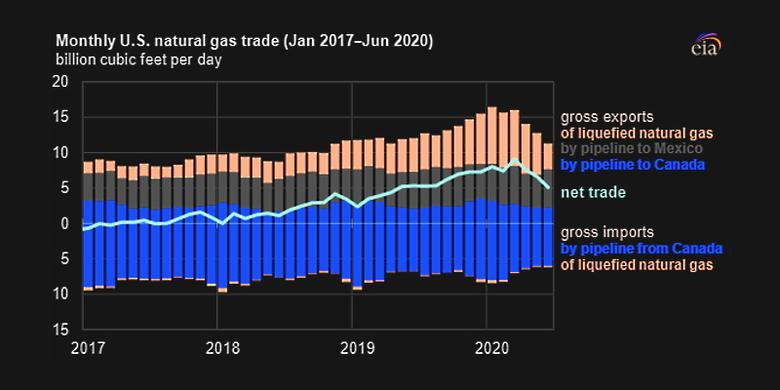
U.S. EIA - SEPTEMBER 15, 2020 - In 2017, the United States exported more natural gas than it imported on an annual basis for the first time in nearly 60 years, making it a net natural gas exporter. Since then, U.S. net natural gas exports have more than doubled every year: from 0.3 billion cubic feet per day (Bcf/d) in 2017 to 2 Bcf/d in 2018 and to 5.2 Bcf/d in 2019. Although growth in net natural gas exports continued in the first six months of 2020 (compared with the same period in 2019), net exports began declining in spring 2020 as a result of a global economic slowdown amid the spread of the coronavirus disease (COVID-19) and related containment efforts. Starting in April, U.S. natural gas traded as liquefied natural gas (LNG) and by pipelines declined significantly, according to the U.S. Energy Information Administration’s (EIA) recently released Natural Gas Monthly, which includes data through June 2020.
The United States is a net exporter of LNG and natural gas by pipeline to Mexico and is a net importer of natural gas by pipeline from Canada. In the first half of 2020, net exports of natural gas averaged 7.3 Bcf/d, or nearly 80% (3.2 Bcf/d) more than during the same period last year. In the first six months of 2020, net LNG exports increased by almost 60% (2.4 Bcf/d), net pipeline exports to Mexico increased by 4% (0.2 Bcf/d), and net imports by pipeline from Canada declined by 12% (0.6 Bcf/d) compared with the first six months of 2019.
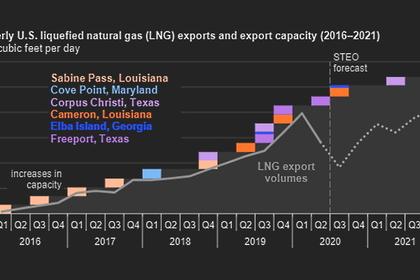
Between 2017 and 2019, growth in LNG exports led the increase in net natural gas exports. Since the first LNG cargo was exported from the Lower 48 states in February 2016, both U.S. LNG export capacity and volumes have grown substantially. In 2020, U.S. LNG export capacity continued year-over-year growth as the third trains at Freeport LNG and Cameron LNG were placed in service. EIA estimates that U.S. LNG baseload operating liquefaction capacity currently stands at 8.9 Bcf/d (10.1 Bcf/d peak) across six LNG facilities with 14 full-size trains and 10 small-scale moveable modular liquefaction system trains.
U.S. LNG exports continued to grow in the first three months of 2020, averaging 7.9 Bcf/d, a 3.9 Bcf/d (98%) increase compared with the same period last year. LNG exports started to decline in April amid global reduction in natural gas consumption and a decline in global natural gas and LNG prices. In June 2020, U.S. LNG exports averaged 3.6 Bcf/d, or less than half of January’s LNG exports, and they continued to decline in July to 3.1 Bcf/d.
U.S. LNG imports in the first half of 2020 were similar to imports in the first half of 2019, averaging 0.2 Bcf/d. About one-half (56%) of LNG imported in the first six months of 2020 went to the Everett LNG terminal (located offshore from Boston, Massachusetts), primarily to meet New England’s winter space heating demand. Several LNG cargoes were also imported to Cove Point terminal in Maryland and Elba Island terminal in Georgia.

U.S. natural gas exports by pipeline to Mexico have been growing gradually following an expansion of cross-border pipeline capacity from the United States to Mexico. In the first half of 2020, U.S. pipeline exports to Mexico averaged 5.1 Bcf/d, a 4% increase (0.2 Bcf/d) compared with the same period last year. In June 2020, a part of the Wahalajara pipeline system was placed in service. This pipeline system connects natural gas supply from the U.S. Permian Basin at the Waha Hub to Mexico’s central and western regions. Since then U.S. pipeline exports to Mexico have increased to 5.4 Bcf/d, mainly displacing Mexico’s LNG imports from the United States and other countries. EIA forecasts that U.S. pipeline exports to Mexico will continue to grow in the coming months.

U.S. pipeline exports to Canada averaged 2.6 Bcf/d and remained unchanged in the first six months of 2020 compared with the same period last year and the 2019 annual average.
However, U.S. natural gas pipeline imports from Canada have declined by 0.7 Bcf/d (9%) in the first half of 2020 compared with the same period last year. The decline was mainly because of higher natural demand in Canada at the end of the winter season because of low storage inventories and higher natural gas spot prices in Canada at the NOVA/AECO-C (AECO) trading hub compared with Henry Hub spot prices in the United States.

According to the September 2020 Short-Term Energy Outlook, EIA forecasts net natural gas exports to continue increasing in the coming months primarily because of increasing U.S. LNG exports. LNG exports are expected to remain relatively low in September, in part because of the damage to electric transmission infrastructure near Cameron LNG, which could delay the restart of exports from the terminal for several weeks. However, EIA forecasts LNG exports to return to pre-COVID levels by November 2020 and average more than 9 Bcf/d during the winter of 2020–21.
-----
Earlier:
2020, September, 15, 16:30:00
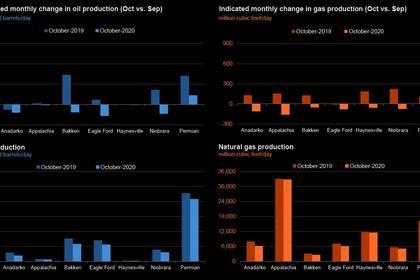
U.S. PRODUCTION: OIL (-68) TBD, GAS (-428) MCFD
Crude oil production from the major US onshore regions is forecast to decrease 68,000 b/d month-over-month in September from 7,708 to 7,640 thousand barrels/day, gas production to decrease 428 million cubic feet/day from 81,026 to 80,598 million cubic feet/day .
2020, September, 3, 12:35:00
U.S. LNG WILL UP
LNG became “the worst-performing global energy commodity” during the pandemic, the Institute for Energy Economics and Financial Analysis (IEEFA) said on July 29.
2020, September, 1, 15:00:00
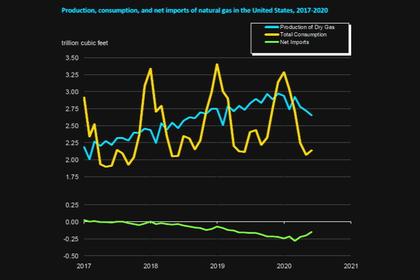
U.S. GAS PRODUCTION DOWN ANEW
The preliminary level for U.S. dry natural gas production in June 2020 was 2,650 billion cubic feet (Bcf), or 88.3 Bcf/d.


